The Shrinking Salton Sea
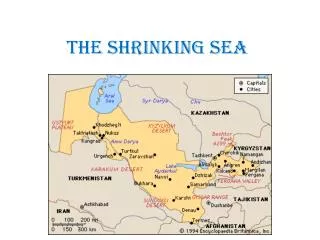
The Shrinking Salton Sea. Madison Rasmus GIS in Water Resources November 28, 2017. Background. Location: lowest portion of the desert valley in Imperial and Riverside Counties (Salton Basin) Salton Sea as we know today was formed in 1905 via a Colorado River canal breach

The Shrinking Salton Sea
E N D
Presentation Transcript
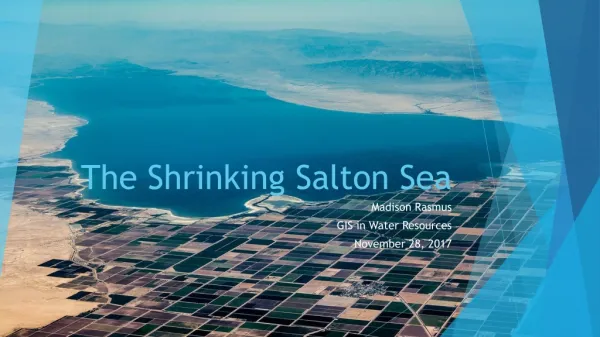
The Shrinking Salton Sea Madison Rasmus GIS in Water Resources November 28, 2017
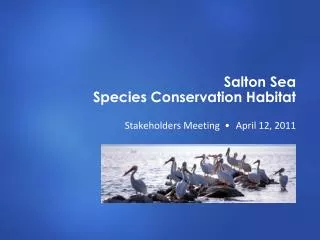
Background • Location: lowest portion of the desert valley in Imperial and Riverside Counties (Salton Basin) • Salton Sea as we know today was formed in 1905 via a Colorado River canal breach • 18 months of continual flooding between 1905-1907 • California’s largest lake • Surface area: 343 mi2 • 110 miles of shoreline • Average depth: 29 feet
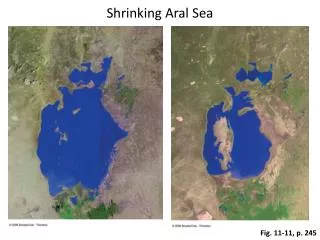
History • The Salton Basin formed in prehistoric times via mountain uplift and sediment transport from the Colorado River • It was assumed the Salton Sea would dry up as it had done in the past but a consistent supply of agricultural runoff from kept the sea at a consistent size • Designated as an official farm drainage reservoir in 1924 by the Federal Government • Thrived as a prominent fishery and vacation spot up until the 1980s • Fish supplied by the US Fish & Wildlife Department • California’s most visited State Park up until the mid 1980s
Current Environmental Concerns • Rising salinity • Currently estimated to be 50 times saltier than the Pacific Ocean • Salton Sea fed by agricultural runoff with incredibly high levels of salt, pesticides, selenium and other harmful chemicals • Attempts to regulate inflow quality have been largely unsuccessful • Reduced inflows • Inflows ≠ evaporative losses • Sea is shrinking and exposing toxic lake bed • Ecosystem disruptions Source: LiveScience
Quantification Settlement Agreement (QSA) • Established in 2003 between the Imperial Irrigation District, San Diego County Water Authority, and Metropolitan Water District • Transfers more water Colorado River water to San Diego, Orange, and Los Angeles Counties to accommodate rising municipal demand • Farmers in the Imperial Valley have financial incentives to reduce agricultural water use • Imperial Irrigation District required to provide makeup water to the Salton Sea until the end of this year Source: Salton Sea Authority
QSA Data Source: USGS Source: Imperial Irrigation District
Salton Sea, 2033 Source: LA Times
GIS Analysis • HUC8 Watershed generated with NHDPlus dataset • Over 5000 mi2 extending primarily into Riverside and Imperial County
GIS Analysis • Flowlines generated NHDPlus dataset • New River and Alamo River – main sources of agricultural inflow to the Sea
Next Steps • Extrapolate effects on the Salton Sea after IID makeup water stops at the end of this year • Look into current municipal uses in San Diego, Orange, and LA Counties
References • Salton Sea Authority • http://saltonseaauthority.org • USGS Stream Data • https://waterdata.usgs.gov/nwis/rt • USGS Water Use Data • https://water.usgs.gov/watuse/data/index.html • Imperial Irrigation District QSA Annual Reports • http://www.iid.com/water/library/qsa-water-transfer/qsa-annual-reports