Download
1 / 53
530 likes | 668 Vues
This analysis explores the Cosmic Microwave Background (CMB) anisotropy as observed through the WMAP data. We delve into the implications of gravitational potentials and quantum fluctuations that influenced the structure of our universe. Highlighting significant developments from 1992 and citing Stephen Hawking's remarks, we discuss the correlation of acoustic peaks in the CMB, the baryon-photon dynamics, dark matter's influence, and calibration challenges encountered in measurement. The findings extend our understanding of cosmic inflation, structure formation, and the universe's density parameters.

E N D
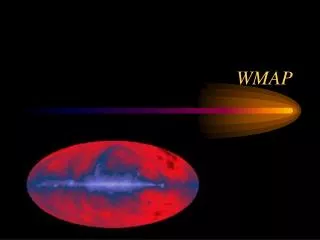
CMB Anisotropy thru WMAP III Ned Wright, UCLA
True Contrast CMB Sky 33, 41 & 94 GHz as RGB, 0-4 K scale
Enhanced Contrast: • Conklin 1969 - 2 • Henry 1971 - 3 • Corey & Wilkinson 1976 - 4 • Smoot et al. 1977 - 6
A Big Media Splash in 1992: 25 April 1992 Prof. Stephen Hawking of Cambridge University, not usually noted for overstatement, said: “It is the discovery of the century, if not of all time.”
Animated View of Inflation • Quantum fluctuations occur uniformly throughout space-time • Future light cones have radii of (c/H)[exp(Ht)-1]
COBE DMR vs EPAS “Chi-by-eye” suggests that the “Equal Power on All Scales” prediction of inflation is correct.
Sachs-Wolfe Effect: Gravitational potential = 3c2T/T Leads to Large-Scale Structure
Prediction of Acoustic Peaks in CDM Bond & Efstathiou, 1987, MNRAS, 226, 655-687
Two Fluids in the Early Universe • Most of the mass is dark matter • 80-90% of the density • Zero pressure • Sound speed is zero • The baryon-photon fluid • baryons are protons & neutrons = all ordinary matter • energy density of the photons is bigger than c2 times the density of baryons • Pressure of photons = u/3 = (1/3) c2 • Sound speed is about c/3 = 170,000 km/sec
Interference at last scattering • For the wavelength illustrated [1/2 period between the Big Bang and recombination], the denser = hotter effect and potential well = cooler effect have gotten in phase. • For larger wavelengths they are out of phase at recombination:
Many parameters to measure Careful measurements of the power at various angular scales can determine the Hubble constant, the matter density, the baryon density, and the vacuum density.
Pre-WMAP Power Spectrum Flat, n=1; b = 0.021, c = 0.196, Ho = 47; b = 0.022, c = 0.132, Ho = 68, = 2/3
Calibration Uncertainties • Each experiment (except for COBE and later WMAP) has amplitude uncertainty of several percent that is correlated across all the data from that experiment. • I have done fits and plots that solve separately for calibration adjustment “nuisance parameters” which are included in the 2 but not in the errorbars. • Combining data from many experiments gives a “flexible” observed spectrum due to these calibration errors.
The WMAP RF plumbing is very complexwith 10 horns per side, 20 DA’s, 40 amplifier chains.
Huge Amount of Data • 5 bands. • 23, 33, 41, 61 & 94 GHz. • 2, 2, 4, 4 & 8 temperature differences per band. Two detectors for each differential T. • 128, 128, 102.4, 76.8 & 51.2 ms/sample. • 279 temperature differences per second. • 53 billion samples in 3 years. • About 2108 samples per low l polarization. • Systematic error control is critical!
Temperature Stability • 7% p-p yearly insolation modulation from eccentricity of Earth’s orbit • Slow change in thermal properties: 3%/yr in albedo or emissivity. Pioneer anomaly could be explained by 3% emissivity anisotropy.
Scan Strategy Not to scale: Earth — L2 distance is 1% of Sun — Earth Distance • 6 Months for full sky coverage 2 minute spin 1 hour precession
Noise Pattern is not Uniform • Stokes I, Q, U & <QU> all have different noise patterns.
Scattering creates Polarization Reionization puts scatterers at A: many degree scale Scatterers during recombination are at B: degree scale
Top view of same S-T Diagram • Electrons at A or B see a somewhat different piece of the surface of last scattering than we do. • If electrons at A or B see a quadrupole anisotropy then we get polarization.
ROM Foreground Fit in P06 Cut • m = -0.6 • EE • Bs = 0.36, s = -3.0 • Bd = 1.0, d = 1.5 • BB: • Bs = 0.30, s = -2.8 • Bd = 0.50, d = 1.5
Final Results EE only: = 0.10 0.03 TT, TE & EE: = 0.09 0.03
Comparison to Previous Best Fit • Now we have = 0.09 0.03 instead of = 0.117 0.055 for the WMAP I best fit. • But quite a bit less than the old WMAP I TE only = 0.17 0.04
Effects on Peak Position: lpk • Open or vacuum dominated Universes give larger distance to last scattering surface • High matter density gives smaller wavelength
CMB alone does not imply flatness • But CMB + Ho (or other data) do imply flatness and a dark energy dominated Universe.
Non-flat Dark Energy Fitting! • k = 0, w = -1 is OK: -0.93 > w > -1.14 With many datasets combined, the equation of state w and the curvature can be measured together.
Late ISW Effect: Another test for Potential only changes if m 1 (or in non-linear collapse, but that’s another story [Rees-Sciama effect]).
CMB-LSS correlation seen by WMAP • This late ISW effect occurs on our past light cone so the T we see is due to structures we also see. • Correlation between WMAP and LSS seen by: • Boughn & Crittenden (astro-ph/0305001) at 2.75 with hard X-ray background and 2.25 with NVSS • Nolta et al. (astro-ph/0305097) at 2 with NVSS • Afshordi et al (astro-ph/0308260) at 2.5 with 2MASS