Download
1 / 2
30 likes | 351 Vues
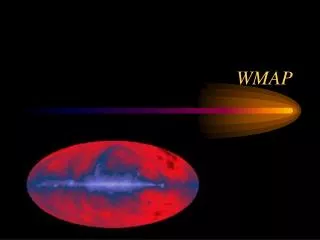
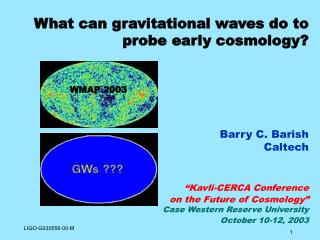
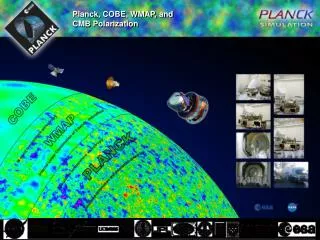
Planck, COBE, WMAP, and CMB Polarization. The CMB Sky.

E N D
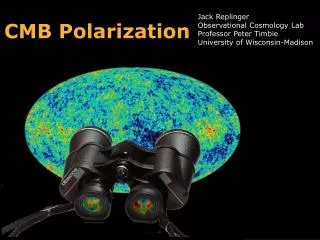
The CMB Sky The photographs show the con-struction and integration of Planck at Alcatel in Cannes, with the space-craft bus, V-groove radiators, and telescope easily visible. The Cryo-genic Qualification Model (CQM) is shrouded. The Flight Model in these photos includes only the spacecraft bus and the V-groove assembly, which provides thermal isolation and radiative cooling between the warm spacecraft bus and the cold tele-scope and instrument assembly. The images at the bottom show the CQM being shipped from Alcatel to CSL in Liege for thermal/vacuum testing. In flight, the telescope tem-perature is expected to be well below 50 K. Below is the Planck payload qualification model at Alcatel (Cannes), in the config-uration used for acoustic testing. The qualification model of the primary reflec-tor can be seen. The image on the reverse side shows part of the cosmic microwave background (CMB) sky as measured by three different experiments. In the upper left corner are COBE1 data at a resolution of 7 degrees. Next is the CMB as seen at 94GHz by WMAP2, with a resolution of ~15 arcm. Instrument noise dominates at the pixel scale, so the image has been smoothed to the angular resolution at which it was measured. Next is a strip in which WMAP data from all bands are combined and smoothed, controlling foreground emission and noise at the expense of angular resolution. Next is simulated Planck temperature data, smoothed to 5 arcm. The increase in resolution of Planck compared to the other two experiments is apparent. Finally, simulated Planck polarization data, smoothed to 15 arcm, are shown superimposed on the temperature anisotropies using a vector field visualization technique described below. Planck’s sensitivity, angular resolution, and frequency coverage will allow it to extract essentially all available information on primary CMB temperature anisotropies, and make a dramatic advance in measurements of CMB polarization. 1Smoot, et al. 1991, ApJL, 371, L1 2Bennett, et al, 2003, ApJS, 148, 1 Visualizing Polarization It is difficult to simultaneously represent CMB temperature fluctuations and the direction and magnitude of the CMB’s partial polarization on the same 2-dimensional sky map. The approach we have used is a line integral convolution technique suggested by Cabral and Leedom3. The detail in the image on the reverse side is much finer than the printer can show, but is clear on the 5’ x 10’ display poster. An enlarged version of part of the map is shown to the right. The direction of the ‘stripes’ indicates the direction of the polarization. Darker stripes indicate stronger polarization; the stripes fade away as the polarization drops to zero. All of this is overlaid on the conventional temperature map. The large poster on display at the Planck booth makes it possible to see this level of detail in the polarization signal across a large part of the sky 3Cabral and Leedom 1993, Proceedings of the 20th Annual Conference on Computer Graphics and Interactive Techniques, p263-270