Download
1 / 16
170 likes | 313 Vues
O UTLINE Why are we interested in linking GEOS-CHEM with regional air quality model (CMAQ)? Technical issues to consider when linking GEOS-CHEM & CMAQ Upcoming results from two relevant EPA projects. Why does EPA want to link GEOS-CHEM with regional air quality model (CMAQ)?.

E N D
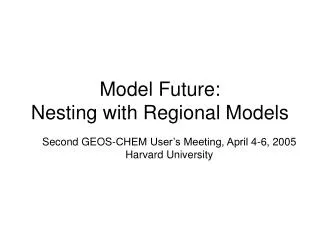
OUTLINE • Why are we interested in linking GEOS-CHEM with regional air quality model (CMAQ)? • Technical issues to consider when linking GEOS-CHEM & CMAQ • Upcoming results from two relevant EPA projects
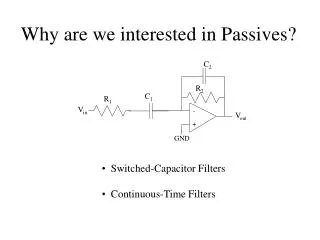
Why does EPA want to link GEOS-CHEM with regional air quality model (CMAQ)? • Intercontinental transport of pollutants • What are the impacts of trans-Pacific transport of O3, PM, and other pollutants on U.S. air quality? • How about trans-Atlantic transport (export)? • Climate and Air Quality studies • Climate change impacts on air quality • Air quality impacts on climate • Continental domain CMAQ simulations • Can model results improve using the boundary conditions provided by the GEOS-CHEM?
U.S. CMAQ Modeling: O3(e.g., 1996 July Max in ppb) 56 99 149 62 134 76 132 139 137 107 126 119 131 215 127 144 113 194
USEPA Community Multiscale Air Quality Model (CMAQ) • Gas phase chemical mechanisms: SAPRC99, CB4, RADM2 • Aerosols: Binkowski and Roselle [JGR, 2003] • Resolution ranges from regional (e.g., 36 km2 grid) to urban (e.g., 4 km2 grid) scale • Vertical layers range (e.g., 15 to 23) and go up to 100mb • Emission fields based on USEPA National Emissions Inventory (e.g., NEI99 v2), BEIS 3.10, and Mobile 6 • Meteorology typically generated using the NCAR/Penn State Mesoscale Model (MM5 v3)
Spatial Resolution Issues • Scale of CMAQ simulations • regional (e.g., 36×36 km2) scale • nested finer scale (e.g., 12×12 km2, 4×4 km2) • Hourly time scale for input and output • Matching GEOS-CHEM fields with CMAQ for boundary conditions • If 4×5, > 10 CMAQ grids to 1 GEOS-CHEM grid along vertical boundaries • Different projections (cartesian vs conformal)
CMAQ upper boundary conditions • CMAQ typically up to 100 mb • With fairly coarse layers at top, tropopause not resolved • Without tropopause dynamics, lower stratospheric [O3 ] not an option • O3 fluxes from GEOS-CHEM would be an option
Consistencies between GEOS-CHEM and CMAQ • Emission inventories over U.S. • Global Climate Modeling for future climate change scenarios • MM5 mesoscale model can use GCM BCs • Similar greenhouse gas scenarios • Chemical fields simulations • O3 • Speciated aerosols (sulfate, nitrate, organics,…) • Hg
Upcoming results from 2 relevant EPA studies • Climate Impacts on Regional Air Quality (CIRAQ): USEPA ORD • Intercontinental transport and Climate Effects of Air Pollution (ICAP): USEPA OAQPS
Simulations from CIRAQ Project(Climate Impacts on Regional Air Quality) For U.S. Continental Domain • 10-yr MM5 mesoscale model runs (complete 2004) • 1990-2003 • 2040-2050 • 36×36 km2 resolution • GISS II’ GCM boundary conditions (collaboration with Harvard) • IPCC A1B greenhouse gas emission scenario • 5-yr CMAQ simulations (complete 2006) • 1999-2003 • 2045-2050 • O3 and PM predictions • 36×36 km2 resolution • Base NEI99 v2 emissions for 1st incremental phase tests • SAPRC chemical mechanism • Boundary conditions driven by GEOS-CHEM (with GISS II’ GCM, IPCC A1B) (collaboration with CMU and Harvard, through STAR EPA coops) • Analysis of results included in EPA GCRP air quality national assessment report in 2007
Simulations from CIRAQ Project(Climate Impacts on Regional Air Quality) • Future (2050) air quality emission scenarios • Technology assessments for mobile and utility sectors • Population and economic projections consistent with IPCC, more spatially resolved • External collaborations to be determined • Proposals under review at STAR program • CMAQ 2050 simulations with future air quality emission scenarios (tentatively planned for 2010 EPA GCRP AQ assessment)
Results from ICAP Project(Intercontinental transport and Climate Effects of Air Pollution) • 2001 trans-Pacific and trans-Atlantic domain CMAQ simulations, 108-km grid (spring 2004) • 2001 national domain CMAQ simulations, 36-km grid; episodic eastern & western US domains, 12-km grid (spring/summer 2004) • Emission inventory for Asia (O3, PM, Hg)
ICAP Trans-Pacific Domain ICAP Trans-Atlantic Domain
ICAP: Refinement of Asian emission inventory for CMAQ Trans-Pacific Simulations NO emissions
Next Directions at EPA • Assessment of future climate change impacts on AQ expanded to 2100 • Develop bidirectional feedback between CMAQ and MM5/WRF for aerosol impacts on meteorology • Agency long-term planning for intercontinental transport research underway