Download
1 / 37
370 likes | 486 Vues
This work details the retrieval of sulfur dioxide (SO2) using ultraviolet (UV) data from satellite missions, particularly the GOME-2 aboard the Metop-A satellite. It explores methods for extracting atmospheric parameters through inverse problems, employing forward modeling and the Beer-Lambert Law. The paper reviews the challenges of spectral fitting, aerosol calibration, and the discrepancies in surface SO2 measurements. It also discusses the impacts of anthropogenic and natural sources on SO2 levels, and advances in optimal estimation algorithms for improved retrieval accuracy.

E N D
SO2Retrievals in the UV from Space Caroline Nowlan Atomic and Molecular Physics Division Harvard-Smithsonian Center for Astrophysics Collaborators: Kelly Chance, Xiong Liu, Thomas Kurosu, Chulkyu Lee, Randall Martin, Sajeev Philip
Nadir UV-Visible Retrievals at SAO • Upcoming: • OMPS, GOME-2 B, UVAS, GEO-Cape, …
Remote Sounding: Inverse Problem • We have y (spectral data) with errors e • We want x (atmospheric parameters) • Requirements for inversion • Forward model (F) • Retrieval algorithm
Beer-Lambert Law andOptical Depth Length L I0 I • t = optical depth • = absorption cross-section (cm2/molecule) • n= density (molecules/cm3) • L = length of path (cm)
Spectral Fitting in UV-visible-NIR • Molecules • Ozone, NO2, HCHO, SO2, H2O, O2, O2-O2, IO, CHO-CHO, BrO, OClO • Polynomials for background and scaling • Aerosols, calibration issues • Rotational Raman scattering • Instrument Considerations • Wavelength to detector pixel calibration • Slit function width (resolution) • Undersampling
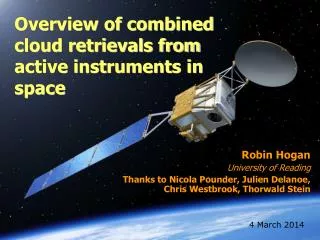
GOME-2 • Global Ozone Monitoring Experiment • Metop-A satellite • Launched October 2006 • Useful data since January/March 2007 • 4 channels, each with 1024-pixel photodiode array • 240 – 314 nm • 310 – 403 nm • 397 – 604 nm • 593 – 790 nm • Nadir-viewing • Nominal ground pixel = 80 x 40 km2
SO2 • Anthropogenic sources (≈70 %) • Fossil fuel burning • Smelting • Natural sources (≈30 %) • Dimethyl sulfide from oceans • Volcanoes • Biomass burning • Effects on • Climate from sulfate aerosol formation • Regional or global in case of volcanic stratospheric injection • Local pollution • Acid rain
SO2 Retrievals from GOME-2 • Two approaches to SO2retrievals: • Traditional two-step approach • Calculate: • 1. Slant column density (using spectra) in viewing path • 2. Air mass factor (using radiative transfer model and profiles) • Vertical column = Slant Column / AMF • Optimal Estimation • Implements full radiative transfer calculation and climatological profiles directly into one-step retrieval calculation • Much more time-consuming (~100 times longer) • Better consideration of wavelength effects, nonlinearity of AMF under heavy SO2 loading, ozone interference
Optimal Estimation Approach • Nonlinear iterative retrieval • Dx= (KT Se-1K + Sa-1)-1 [KTSe-1Dy– Sa-1(x – xa) ] • x = current guess of retrieved parameter Se= measurement error covariance matrix • K = weighting function matrix • xa= a priori profile (climatology or from a model) • Sa = a priori error covariance matrix
Optimal Estimation Algorithm • Based on ozone profile retrieval developed for • GOME (Liu et al., 2005) • OMI (Liu et al., 2010) • Full radiative transfer calculation using including trace gas profiles • Wavelength window: 312 – 330 nm • Simultaneous fit of • SO2 vertical column • Ozone profile at 24 levels • BrO, HCHO, NO2 vertical columns • Rotational Raman scattering • Effective surface albedo • Effective cloud fraction • Wavelength shift
SO2A Priori Information • Need SO2a priori profile information • Anthropogenic SO2 • GEOS-Chem model (Lee et al., 2009) • Volcanic SO2 • Gaussian plume with FWHM=0.5 km z SO2 mixing ratio volcanic anthropogenic
Spectral Fits 1 Dobson Unit (DU) = 2.69 molecules/cm2
Global SO2 from GOME-2: 2007 Cloud fraction < 0.2, Solar Zenith Angle < 70°, no ice or snow-covered pixels
North American Surface Networks • EPA (Environmental Protection Agency) • AQS (Air Quality System) • Various sites: background, urban, industrial… • Hourly measurements • CASTNET (Clear Air Status and Trends Network) • Background sites • Weekly averages • Environment Canada • NAPS (National Air Pollution Surveillance) • Sites usually in populated areas • Hourly measurements • Comparisons: 40 km and 1 hour, use N > 100 coincidences
North American Surface SO2: 2008 • Excellent correlation with CASTNET, but ~2.5 overestimation • Diurnal variability in mixing layer depth + boundary layer chemistry? (Lee et al., 2010) • AQS/NAPS: More difficulty distinguishing localized SO2 sources
GOME-2 vs. EANET Surface SO2: 2007 R = 0.65
Canadian SO2 Pollution • Top single emitters (2009): • Hudson Bay Mining and Smelting FlinFlon, Manitoba (144 kT) • Vale Inco Thompson, Manitoba (143 kT) • Syncrude Canada Mildred Lake, Alberta (81 kT) Grande Prairie Ft. McMurray Thompson FlinFlon Edmonton Calgary 2007
Volcanic SO2 Mount Kasatochi, Alaska Courtesy: AVO/USGS (Chris Waythomas)
Eyjafjallajökull MODIS April 17, 2010
Eyjafjallajökull, IcelandMay 5th, 2010 A priori SO2 altitude = 5 km Uncertainty = 5 km Altitudes shown for SO2 vertical column > 1 DU
GOME-2 and OMI SO2 Mt. Kasatochi, Alaska 9 August 2008 A priori SO2 altitude = 10 km Uncertainty = 2 km
Can use altitude degrees of freedom for signal to look at how much altitude information really exists DFS > 0.9 for SO2 column > 30 DU
SO2 Tonnage ComparisonsMt. Kasatochi, 9 August 2011 • GOME-2 total SO2 mass from these retrievals compares well with recent OMI and IASI retrievals 9-Aug-2008 only Entire eruption
Volcanic SO2 Altitude Uncertainties • Aerosols are significant uncertainty • Size, type, altitude • Non-homogeneous distribution of SO2 in field-of-view (Yang et al., 2010), mostly at edges of plume
Summary • Main considerations in UV-Visible nadir sounding: • Molecules • Scattering, clouds and aerosols • Instrument calibration • Approaches: • Basic spectral fitting • Optimal estimation • Spectral fitting can be used to derive SO2 vertical columns and in some cases, additional information about altitude • The future: • Geostationary orbit for temporal resolution • Better ground resolution
Summary • GOME-2 vertical columns used to infer surface SO2 using GEOS-Chem • North American background SO2 pattern very well represented, but ~2.5:1 overestimation of weekly averages • Point sources are more difficult to represent • Combining Channels 1 and 2 looks promising • Next steps: • Apply GOME-2 for top-down emissions inventories (Lee et al., 2011) • Comparisons with OMI and SCIAMACHY results • Finish 2007-2010 reprocessing with current algorithm • Dataset should be available in coming months!