Download
1 / 14
140 likes | 277 Vues
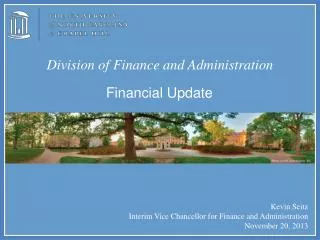
Division of Finance and Administration. Financial Update. Kevin Seitz Interim Vice Chancellor for Finance and Administration November 20 , 2013. State General Fund Revenues. FY 2013-14 Budget (General Fund) $20, 881.3 million*. Other Taxes $715 3%. Individual Income Tax $10, 996.7 53%.

E N D
Division of Finance and Administration Financial Update Kevin Seitz Interim Vice Chancellor for Finance and Administration November 20, 2013
State General Fund Revenues FY 2013-14 Budget (General Fund) $20, 881.3 million* Other Taxes $715 3% Individual Income Tax $10, 996.7 53% Judicial Fees $250 1% Other Non-Tax Revenue $782 4% Unreserved Fund Balance $278 1% Insurance & Franchise $1, 166.2 6% *FY 2013-14 Budget totals $20,630.8 million; $250.5 million left unappropriated Corporate Income Tax $1, 249.2 6%
State General Fund Expenditures FY 2013-14 Budget * $20, 630.8 million Education $11, 470.3 55.6% Statewide Reserves $264.9 1.3% Other $1, 002 4.8% Debt Services $709.2 3.4% Capital $27.9 0.1% General Government $424.8 2.1% Health & Human Services $4,993.8 24.2% Justice & Public Safety $2, 368.7 11.5% Natural & Economic Resources $371.2 1.8% • *General Fund appropriations made from general purpose • revenue and does not include agency receipts
Quarterly General Fund Revenue Report • 2012/13 General Fund revenues were $537.6 million (2.7%) above the $20.04 billion budgeted. • General Fund collections for the first quarter of the 2013/14 fiscal year are $79 million above the revenue target for that period. • Corporate income tax revenue, sales tax and personal income collections were above targets.
Quarterly General Fund Revenue Report • A steady, moderate growth pattern is expected throughout the fiscal year. • Economic recovery growth is about 2%. • Housing appears ready for solid recovery. • State economy is gaining strength. • State unemployment remains 6th highest in the country.
FY 2013-14 Reductions • 2013/14 Budget included three reductions that required allocation by the Board of Governors: • Management and Flexibility ($65.8M) • Instruction Efficiencies ($15.8M) • Operational and Administrative Efficiencies ($10M) • Also permitted the Board of Governors to use up to $15 million of existing funds to implement portions of the strategic plan. • Strategic Investments ($3M) • Specific UNC-CH Reductions • SOM Indigent Care ($15M) • UNC Cancer Research Fund ($8M)
General Reductions by Category Note: Excludes reductions of $15M for SOM Indigent Care and $8M UNC Cancer Research Fund
Areas of General Reduction Note: Excludes reductions of $15M for SOM Indigent Care and $8M UNC Cancer Research Fund
Reduction Allocation Methodology • Management Flex Reduction • Eight measures factored into the management flexibility allocation method: • Freshman-to-Sophomore Retention • Graduation Rate • Degree Efficiency • UNC Fit Index • Weighted Education and Related Spending per Degree • No Tuition • Diseconomies of Scale • Pell Grant Recipients
Reduction Allocation Methodology • Management Flex Reduction (Cont.) • Could not be allocated on an across-the-board basis • Strategic Plan Related Reductions • Allocated on a pro rata basis
Examples of Non Personnel Reductions • Reduced core library materials • Reduced AHEC’s ability to train the number of students, residents, and practicing health care professionals, which may lead to a reduction in the number of graduates who enter practice in underserved and vulnerable communities in the state. • Delayed technology purchases • Reduced office supplies • Reduced support for compliance and safety • Reduced travel • Reduced training