Download
1 / 9
100 likes | 127 Vues
This guide provides step-by-step instructions on how to solve systems of linear inequalities through graphing and shading techniques. Learn through detailed examples showcasing boundary lines and shading methods to find overlapping solution regions.

E N D
Objective Solve systems of linear inequalities by graphing and shading
For x – 3y < 6, graph the dashed boundary line y = – 2, and shade above it. Example 1A: Graphing Systems of Inequalities Graph the system of inequalities. x – 3y< 6 2x + y > 1.5 For 2x + y > 1.5, graph the dashed boundary line y = –2x + 1.5, and shade above it. The overlapping region is the solution region.
Example 1B: Graphing Systems of Inequalities Graph each system of inequalities. y< –3x + 2 y ≥ –1 For y < –3x + 2, graph the dashed boundary line y =–3x + 2, and shade below it. For y ≥–1, graph the solid boundary line y =–1, and shade above it.
Example 3: Geometry Application Graph the system of inequalities, and classify the figure created by the solution region. x ≥ –2 x ≤ 3 y ≥ –x + 1 y ≤ 4
Example 3 Continued Graph the solid boundary line x = –2 and shade to the right of it. Graph the solid boundary line x = 3, and shade to the left of it. Graph the solid boundary line y = –x + 1, and shade above it. Graph the solid boundary line y = 4, and shade below it. The overlapping region is the solution region.
y< – 3 y ≥–x + 2 For y < – 3, graph the dashed boundary line y =– 3, and shade below it. Notes #1 1. Graph the system of inequalities. For y ≥ –x + 2, graph the solid boundary line y = –x + 2, and shade above it. The overlapping region is the solution region.
Notes #2 2. Graph the system of inequalities and classify the figure created by the solution region. y ≤ x – 2 y ≥ –2x – 2 x ≤ 4 x ≥ 1 trapezoid
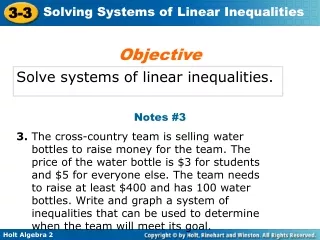
Notes #3 3. The cross-country team is selling water bottles to raise money for the team. The price of the water bottle is $3 for students and $5 for everyone else. The team needs to raise at least $400 and has 100 water bottles. Write and graph a system of inequalities that can be used to determine when the team will meet its goal.
Notes #3 x + y ≤ 100 3x + 5y ≥ 400