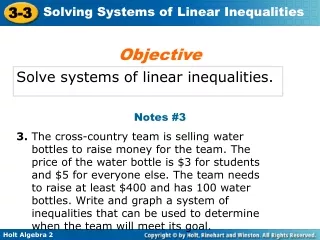
Solve systems of linear inequalities.
80 likes | 249 Vues
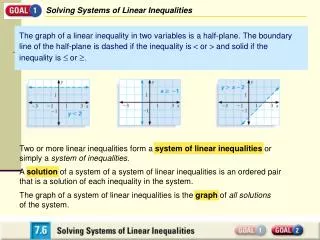
3-3 Notes Objective. Solve systems of linear inequalities. Vocabulary. system of linear inequalities. When a problem uses phrases like “greater than” or “no more than,” you can model the situation using a system of linear inequalities.

Solve systems of linear inequalities.
E N D
Presentation Transcript
3-3 Notes Objective Solve systems of linear inequalities. Vocabulary system of linear inequalities
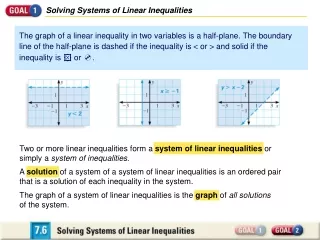
When a problem uses phrases like “greater than” or “no more than,” you can model the situation using a system of linear inequalities. A system of linear inequalities is a set of two or more linear inequalities with the same variables. The solution to a system of inequalities is often an infinite set of points that can be represented graphically by shading. When you graph multiple inequalities on the same graph, the region where the shadings overlap is the solution region.
Example 1: Graphing Systems of Inequalities y< – 3 y ≥–x + 2 Graph the system of inequalities.
Graph each system of inequalities. y< –3x + 2 y ≥ –1
Lauren wants to paint no more than 70 plates for the art show. It costs her at least $50 plus $2 per item to produce red plates and $3 per item to produce gold plates. She wants to spend no more than $215. Write and graph a system of inequalities that can be used to determine the number of each plate that Lauren can make.
Graph the system of inequalities, and classify the figure created by the solution region. x ≥ –2 x ≤ 3 y ≥ –x + 1 y ≤ 4
Graph the system of inequalities, and classify the figure created by the solution region. x ≤ 6 y ≤ x + 1 y ≥ –2x + 4