Stable Isotopes and Microbial Biogeochemistry
520 likes | 546 Vues
Explore the use of stable isotopes in microbial biogeochemistry, including applications, natural isotopes, and measurement techniques. Dive into the marine nitrogen cycle, atmospheric influences, and internal cycling processes. Understand isotopic fractionation and its role in recording microbial, chemical, and physical processes.

Stable Isotopes and Microbial Biogeochemistry
E N D
Presentation Transcript
Karen Casciotti Woods Hole Oceanographic Institution Stable Isotopes and Microbial Biogeochemistry Part 1: Introduction to isotopes and applications using isotope tracers.
Sea Surface Chlorophyll SeaWiFS annual average chlorophyll
Global sea surface nitrate distribution Data from World Ocean Atlas 2005 plotted in ODV
Marine Nitrogen Cycle Atmospheric deposition and continental inputs CO2 Atmospheric N2 N2O N2O Dissolved N2 + NH Particulate 4 DON Nitrogen Fixation N - Assimilation NO 3 Surface ocean Vertical mixing/ Deep ocean upwelling Nitrification NO3- + Remineralization NH 4 Sedimentary N2O Denitrification and Anammox Water column Denitrification and Anammox Sediment Burial
Marine Nitrogen Cycle Atmospheric deposition and continental inputs Nitrogen Fixation N2 Particulate N Surface ocean Deep ocean NO3- + NH 4 Sedimentary Denitrification and Anammox Water column Denitrification and Anammox Input/Output Processes Sediment Burial
Marine Nitrogen Cycle Atmospheric deposition and continental inputs N2O Nitrogen Fixation N2 NH4+ Particulate DON N NO3- Assimilation Surface ocean Deep ocean Vertical mixing/ upwelling Nitrification NO3- Sinking/ Remineralization + NH 4 Sedimentary Denitrification and Anammox Water column Denitrification and Anammox Internal cycling Sediment Burial
Some underlying questions… • What forms of nitrogen support phytoplankton growth in the oligotrophic ocean? • How do phytoplankton communities adapt to different nutrient supplies? • How is the inventory of oceanic nitrogen regulated? • What are the feedbacks between chemistry, climate, and microbial activities? • Who is there and what are they doing?
Overview of Lecture 1 • Introduction to stable isotopes • What are isotopes • Why are they useful/interesting • Applications of tracer-level isotopes to microbial biogeochemistry: • Bulk rate measurements • Metabolic probing with stable isotopes • Taxon-specific rate measurements
Overview of Lecture 2 • Applications of natural abundance isotopes to microbial biogeochemistry: • Isotopic fractionation • Natural variations in isotope ratios--record a history of microbial, chemical, and physical processes • Applications and interpretations • Example 1: Global N budget • Example 2: Sources of N to the euphotic zone
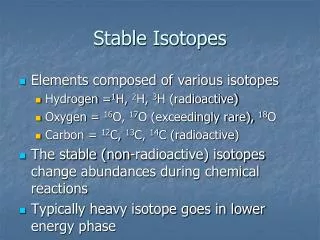
What are isotopes? 14N 7 P 7 e- 7 N 15N 7 P 7 e- 8 N
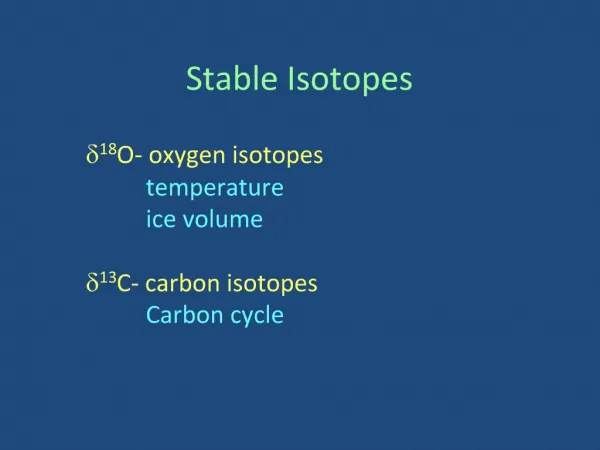
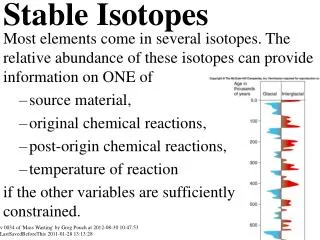
What are isotopes? • Stable vs. radioactive 12C: 98.90 % 13C: 1.10 % 14C: 10-10 % 14N: 99.63 % 15N: 0.37 % 16O: 99.76 % 17O: 0.038 % 18O: 0.20 %
Notation • 15N: The isotope, its molar amount or concentration • 15F: Fractional abundance = 15N/(14N+15N) • 15Atom % = 15F x 100% • 15R: Isotope ratio = 15N/14N • d15N: Delta value (‰) = (15R/15Rstd -1) x 1000
Isotopes of nitrate - - 16O 16O - 16O 14N 15N 14N 16O 16O 16O 16O 18O 16O 14NO3- 15NO3- N16O218O-
Isotope Tracers N2 N2 N2 NH4+ NH4+ NH4+ NO3- NO3- NO3- 15NO3- 15NO3- 15NO3-
Stable isotope measurements Isotope ratios are measured by mass spectrometry: • Gas sample ionized in the ‘ion source’ • Ions accelerated into the ‘flight tube’ • Separation by mass/charge ratio • Detection
Online sample purification for N2O He, N2O, H2O, CO2 Volatile organics Open split He, N2O He GC -60º C Sample vial LN2 -60º C LN2 Mg(ClO4)2 CarbaSorb Nafion Mass Spec EA combustion to N2: 1-5x10⁻⁹ moles of N N2O GC-IRMS: 2-10 x 10-9 moles of N
Overview of Lecture 1 • Introduction to stable isotopes • Applications of tracer-level isotopes to microbial biogeochemistry: • Bulk rate measurements • Metabolic probing with stable isotopes • Taxon-specific rate measurements
‘New Production’ Atmospheric deposition and continental inputs N2 CO2 NH4+ DON N2 Biomass NO3- Surface ocean NO3- Export of C, N Deep ocean
Bulk rate measurements NO3- Concentration NO3- ChlA Nitrate Assimilation Time
Bulk rate measurements N2 NH4+ Concentration NO3- ChlA Nitrate Assimilation Nitrogen Fixation Ammonium Assimilation Ammonification Nitrification NO3- Time
Bulk rate measurements 15At% N2 15Atom % PN NH4+ Concentration 15NO3- ChlA Nitrate Assimilation Nitrogen Fixation Ammonium Assimilation Ammonification Nitrification NO3- Time
Bulk rate measurements 15At% N2 15Atom % NO3- NH4+ Concentration 15Atom % PN 15NO3- PN • Nitrate Assimilation Rate • from 15N incorporation: • Directly proportional to 15At% NO3- • Inversely proportional to [PN] NO3- Time
Bulk rate measurements 15At% N2 15Atom % NO3- NH4+ Concentration 15Atom % PN 15NO3- PN • Nitrate Assimilation Rate • from 15N incorporation: • Directly proportional to 15At% NO3- • Inversely proportional to [PN] NO3- Time
Bulk rate measurements 15At% N2 15Atom % NO3- NH4+ 15Atom % PN Concentration 15NO3- PN Nitrate Assimilation Nitrogen Fixation Ammonium Assimilation Ammonification Nitrification NO3- Time
Bulk rate measurements 15At% N2 15Atom % NO3- NH4+ 15Atom % PN Concentration 15NO3- PN Nitrate Assimilation Nitrogen Fixation Ammonium Assimilation Ammonification Nitrification NO3- Time
New Production Atmospheric deposition and continental inputs N2 CO2 NH4+ DON N2 Biomass NO3- Surface ocean NO3- Export of C, N Deep ocean
Bulk rate measurements 15At% 15Atom % NO3- N2 NH4+ 15Atom % PN Concentration NO3- 15Atom % PN PN Which organisms were responsible for the uptake? What forms of N are different members of the community using? 15Atom % PN NO3- Time
Overview of Lecture 1 • Introduction to stable isotopes • Applications of tracer-level isotopes to microbial biogeochemistry: • Bulk rate measurements • Metabolic probing with stable isotopes • Taxon-specific rate measurements
DNA RNA Lipids Pigments Proteins Substrates* Products Approaches • Sort the whole cells or sort the biomarkers… • Uptake of isotope label from substrates into biomarkers: • Lipids • DNA • RNA • Pigments • Proteins • Separation and analysis of isotopically labeled biomolecules
DNA* RNA* Lipids Pigments Proteins Substrates* Products Stable Isotope Probing (SIP) • Sample is incubated with heavy isotope labeled substrate • DNA or RNA is extracted after incubation • ‘Heavy’ nucleic acids are separated from ‘light’ • ‘Heavy’ nucleic acids are interrogated by: • PCR • Fingerprinting (T-RFLP, DGGE) • Cloning • Sequencing
SIP Example 1: Probing with 13CH3OH Separate by density Extract DNA 13CH3OH Remove fractions Interrogate DNA fractions Neufeld et al., 2008 Environmental Microbiology
SIP Example 1: Probing with 13CH3OH Separate by density Extract DNA 12CH3OH Remove fractions Interrogate DNA fractions Neufeld et al., 2008 Environmental Microbiology
SIP Example 1: Probing with 13CH3OH “Interrogate DNA fractions” • 16S rRNA DGGE of all fractions from 13CH3OH (experimental) incubations and 12CH3OH (control) incubations • Excise, reamplify, and sequence unique bands Neufeld et al., 2008 Environmental Microbiology
SIP Example 1: Probing with 13CH3OH “Interrogate DNA fractions” • Whole-genome amplification of high-density DNA • Fosmid library construction with amplified DNA (17-40 kb fragments) • Screened for methanol dehydrogenase genes. • Shotgun sequenced fosmid containing genes of interest. • Identified Methylophaga Neufeld et al., 2008 Environmental Microbiology
SIP Example 2:15N-DNA SIP • DNA has less N than C • Lower resolving power • 15N gradients: 0.016 g ml-1 • 13C gradients: 0.036 g ml-1 • G+C gradients: 0.050 g ml-1 Low density Increasing G+C content Increasing 15N (or 13C) content High density Buckley et al., 2007a Applied and Environmental Microbiology
SIP Example 2:15N-DNA SIP • DNA has less N • Lower resolving power • 15N gradients: 0.016 g ml-1 • 13C gradients: 0.036 g ml-1 • G+C gradients: 0.050 g ml-1 Low density Increasing G+C content Increasing 15N (or 13C) content High density Buckley et al., 2007a Applied and Environmental Microbiology
SIP Example 2:15N-DNA SIP Increasing G+C content Increasing 15N (or 13C) content Increasing G+C content Increasing 15N (or 13C) content Secondary density gradient With bis-benzimide (AT intercalating agent) Separates according to G+C content Buckley et al., 2007a Applied and Environmental Microbiology
SIP Example 2: Probing nitrogen fixing communities Separate by density Extract DNA Secondary Density separation 15N2 Phylogenetic information = Discovery of novel diazotrophs Buckley et al., 2007b Applied and Environmental Microbiology
SIP Strengths and Limitations • Probing the unculturable (and unpredictable) for metabolic function • Assimilatory processes • Large isotopic enrichments needed • Lots of substrate added • Long incubations • Cross-feeding • G+C content
Overview of Lecture 1 • Introduction to stable isotopes • Applications of tracer-level isotopes to microbial biogeochemistry: • Bulk rate measurements • Metabolic probing with stable isotopes • Taxon-specific rate measurements
DNA* RNA* Lipids* Pigments* Proteins* Substrates* Products Taxon-specific activities • Sample is incubated with isotopically labeled substrate • Cells sorted physically or specific RNA molecules captured • Isotopic content of isolated cells or molecules are determined by: • Mass spectrometry (stable isotopes) • Scintillation counting (radioisotopes) • SIMS?
Taxon-Specific Activity Example 1:N uptake by Prochlorococcus FLOW-SIP: Community incubation with 15N-substrates Flow-cytometric cell sorting Isotopic analysis of sorted cells by EA/IRMS Taxon-specific N uptake rates. Casey et al., 2007 Geophysical Research Letters
32P 33P 33P Taxon-Specific Activity Example 2:N limitation of Prochlorococcus Initial 32P 32P Extract RNA 32P 33P 32P 33PO43- 33P 33P Final 32P 33P 32P 33P Van Mooy and Devol, 2008 Limnology and Oceanography
Taxon-Specific Activity Example 2:N limitation of Prochlorococcus Results: • NH4+ enhanced • total 33P uptake • RNA synthesis rates • Pro. -specific RNA synthesis rates • PO43- and NO3- did not Van Mooy and Devol, 2008 Limnology and Oceanography
32P 33P 33P Taxon-Specific Activity Example 2:N limitation of Prochlorococcus Initial 32P 32P Extract RNA 32P 33P 32P 33PO43- 33P 33P Final 32P 33P 32P 33P Van Mooy and Devol, 2008 Limnology and Oceanography
Secondary Ion Mass Spectrometry (SIMS) Secondary Ions 12C14N-, 12C15N- Primary Ion Beam ~ 50,000 “ion counts” At about 2% ionization efficiency and 80% ion transmission-> ~ 5x10-18 moles of N Courtesy of Francois Herreard, CAMECA
Current Work: The Stable Isotope Array • Massively parallel RNA capture technique • High resolution, high sensitivity 15N/14N or 13C/12C analyses by (Nano)SIMS 15N2 15NO3- 15NH4+ 15Norg 15N Extract RNA Hybridize to microarray Measure 15N/14N