Download
1 / 18
180 likes | 348 Vues
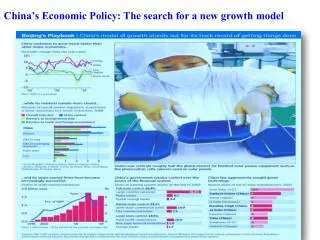
China’s Economic Policy: The search for a new growth model. Economic Reform. Since 1978, economy growing at 10% per annum China as the second largest economy in the world China has rebounded effectively from the global financial crisis with the help of the stimulus package

E N D
Economic Reform • Since 1978, economy growing at 10% per annum • China as the second largest economy in the world • China has rebounded effectively from the global financial crisis with the help of the stimulus package • 2011 economic growth 9.2%, with inflation at 5.3% • IMF—China’s GDP will surpass US in 2016 on PPP basis • Economist –in dollar terms, converted at market exchange rates = 2018
Economic Reform • Caution with the growth figures • 2005, China’s GDP = 1/5 of the US = GDP per capita of 41,700 = USA in 1850 • With the current growth rate in 2020, China’s per capita income will = Malaysia in 2007 and by 2030 will reach the level of Hungary and the Czech Republic in 2007 • This year = South Africa, Botswana and Jamaica • Growth derives from two main transitions • Shift from low productivity to higher productivity work • Shift from central planning to a more market-influence economy
Stimulus Package • Stimulus package of 4 trillion yuan ($570 billion)—November 2008 • Produced reasonably broad-based growth, a classic V-shaped recovery • 1st quarter 2009 GDP rose 6.2% and by 10.7% in 4th quarter—annual growth of 8.7% • Thus, January 2010, tightening of monetary policy and control over banks • Lending was up 30% in 2009 • Originally: Public infrastructure (38%--actual 23%); Post-earthquake reconstruction (25%--actual 14%); social welfare (10%); rural development (9%); technology investment (9%); sustainable development (5%); education and culture (4%)
Stimulus Package • Some of the amounts listed were already ear-marked • The money for the Wenchuan earthquake • Money budgeted for railway investment 2006-10 • 120 billion a year of corporate value-added tax cuts • Amounts to perhaps 2-2.3 trillion yuan • Deutsche Bank calculate that 90% of the funding was already in prior investment plans • The stimulus was a fiscal stimulus of between 1.5 and 1.7% of GDP • 18 Beijing Summer Olympics
Stimulus Program • Stimulus worked but are there long-term negative effects? • Distorted the economy by reversing the long-term for state retreat from economic engagement and for greater private engagement • Will bad loans rise again? • Has it deflected the policy attempts to develop consumption as the main economic driver? • Jan. 2008 Xinhua reported that consumption replaced investment as main driver of growth in 2007—growth was 11.4%; 4.4% from consumer spending; 4.3% from investment; 2.7% from net exports • But 2009: of 8.7% growth—8% from investment, 4.6% from consumption, and -3.9% from net exports • 2011, moving back to better balance: 9.2% growth—5% from investment, 4.5% from consumption and -0.01% from net exports • Other criticisms: risk of rising inflation, property and equity market bubbles; and excess industrial capacity
Stimulus Program • Did not advantage SOEs at expense of private firms • Did not alter long-term trend with private firms becoming the most important driver of economic growth • 2009-10 bank loans did not flow primarily to SOEs • Access of private firms and household businesses to bank credit improved considerably
Stimulus ProgramNeglect of Consumption • Investment was expanded to offset decline in trade • Consumption growth in 2009 was robust and was almost same as GDP growth • Investment boom created jobs in construction • Wages continued to rise • Pension and MLSS payments • Led to 9.8% increase in disposable income of urban residents and 8.5% for rural (2009) • Measures to encourage consumption: car sales, home appliance subsidy program • Increases in household borrowing • But 2010—household consumption down as share of GDP by 1.2% to all-time low of 33.85 • Thus, claim exaggerated for 2009 but valid for 2010
Return of the State? • Since 2003, market strengthening reform slowed • But in 2009-10, loans did not go overwhelmingly to SOEs and household business borrowing expanded fastest • 1995—SOEs = 2/3 of exports, by 2008 = 18% and 14% by 2010 • Private firm share doubled to 30%--most important source of growth in exports • SOEs maintained monopoly in telecommunications, finance, petroleum etc.
New Growth Model? • Formed the core of the new five-year plan: emphasizes quality of growth over quantity • Four Primary Initiatives: • Lower economic growth targets • Increase consumption • Energy savings and environmental protection • Promote strategic industries
New Growth Model?Growth • 2012 = 8%; FYP = 7.5% • 11th FYP called for 7.5% but was closer to 10% • Beijing and Shanghai only announced growth rates close to target and some provinces announced 13% or higher • Concern over below 8% growth for covering employment demands
New Growth Model?Increased Consumption • Investment and Foreign trade have been major drivers of growth • Trade: • Post-WTO imports grown 17% p.a., exports grown 15% = 5x higher than growth in world trade • Trade declined from 70% of GDP to 63% in 2007 and 44% in 2009 • Investment • 1978-88 36% of GDP roughly same as other East Asian successes • 2003– over 40% • 2003-10 investment = average of 54% of economic growth
New Growth Model?Increased Consumption • First half of 1980s consumption growth was 4/5 of economic expansion but 2003-10 averaged barely 2/5 • New FYP calls for household disposable income to increase by 7% • BUT expansion held in check by high savings rate—over 40%, US under 1%, OECD average = 10%; Singapore similar • Raise consumption from 35.1% to 41% of GDP • Low compared to other countries • US = 71% • Brazil = 63% • India = 54%
New Growth Model?Increased Consumption • Measures to boost consumption • Raise minimum wages • Personal income tax reform • Improve land distribution • Expand social welfare initiatives • Increase dividends paid by SOEs to their owner, i.e. the state • Elimination of remaining government controls on interest rates on both deposits and loans • Appreciation on the currency
New Growth Model?Strategic Industries • Investment in “Strategic Emerging Industries” • 7 industries with 14 trillion yuan to be invested to raise contribution from 5% of GDP to 8% by 2015 and 15% by 2020 • Biotechnology • New energy • High-end equipment manufacturing • Energy conservation and environmental protection • Clean-energy vehicles • New materials • Next generation IT
New Growth Model?Political Opposition • Coalition of vested interests that have blocked reforms • Export and import competing industries • Coastal provinces • Real estate and construction industries • China’s commercial banks