Download
1 / 105
1.05k likes | 1.21k Vues
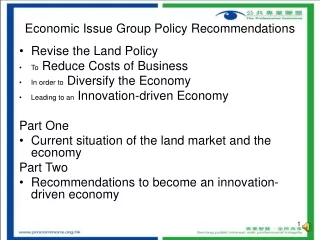
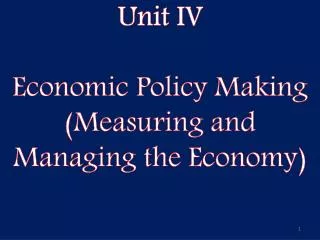
Unit IV Economic Policy Making (Measuring and Managing the Economy). Unit IV. Economic Policy Making (Measuring and Managing the Economy) Key Understandings: Government actions affect economic activity . What is unseen is just as important as what is seen.

E N D
Unit IV Economic Policy Making (Measuring and Managing the Economy)
Unit IV.Economic Policy Making (Measuring and Managing the Economy) • Key Understandings: • Government actions affect economic activity. What is unseen is just as important as what is seen. • The are no free lunches, governments must evaluate all of the costs and benefits of their decisions. • Government actions and decisions must be evaluated on their outcomes and not their intentions. • The true measure of a successful economy is production and standards of living.
Key Terms: Macroeconomics - The field of economics that studies the behavior of the aggregate economy. Macroeconomics examines economy-wide phenomena such as changes in unemployment, national income, rate of growth, gross domestic product, inflation and price levels Economic Indicator- a statistic about an economic activity. Economic indicators allow analysis of economic performance and predictions of future performance. One application of economic indicators is the study of business cycles. Economic indicators include various indices, earnings reports, and economic summaries. Gross Domestic Product (GDP)- is the market value of all officially recognized final goods and services produced within a country in a given period of time. GDP per capita is often considered an indicator of a country's standard of living. Unemployment Rate- Unemployment (or joblessness) occurs when people are without work and actively seeking work.The unemployment rate is a measure of the prevalence of unemployment and it is calculated as a percentage by dividing the number of unemployed individuals by all individuals currently in the labor force. Inflation rate- a rise in the general level of prices of goods and services in an economy over a period of time. When the general price level rises, each unit of currency buys fewer goods and services. Consequently, inflation reflects a reduction in the purchasing power per unit of money – a loss of real value in the medium of exchange and unit of account within the economy.
Key Terms: Business Cycle- the term refers to economy-wide fluctuations in production, trade and economic activity in general over several months or years in an economy organized on free-enterprise principles. The business cycle is the upward and downward movements of levels of GDP (gross domestic product) and refers to the period of expansions and contractions in the level of economic activities (business fluctuations) around its long-term growth trend Nominal vs. Real values- a nominal value is an economic value expressed in monetary terms (that is, in units of a currency). By contrast, a real value is a value that has been adjusted from a nominal value to remove the effects of general price level price changes over time. In other words, nominal is a value that has not been adjust for inflation and real is the value after it has been adjusted for inflation. For example, you will read about nominal GDP and real GDP. Per Capita- per individual. For example, income per capita or income per person. Per capita statistics yield more realistic result because one person is one person, always has been and always will be. Households/ Per family- The household is often used as the basic unit of analysis in many social, economic and government models. The term refers to all individuals who live in the same dwelling. The term is misleading because unlike per capital, the size of households have changed over time.
Key Terms: Aggregate Demand- The total amount of goods and services demanded in the economy at a given overall price level and in a given time period. It is represented by the aggregate-demand curve, which describes the relationship between price levels and the quantity of output that firms are willing to provide. Normally there is a negative relationship between aggregate demand and the price level. Also known as "total spending". Aggregate Supply- The total supply of goods and services produced within an economy at a given overall price level in a given time period. It is represented by the aggregate-supply curve, which describes the relationship between price levels and the quantity of output that firms are willing to provide. Normally, there is a positive relationship between aggregate supply and the price level. Rising prices are usually signals for businesses to expand production to meet a higher level of aggregate demand. Also known as "total output". Fiscal Policy- the use of government revenue collection (taxation) and expenditure (spending) to influence the economy. The two main instruments of fiscal policy are changes in the level and composition of taxation and government spending in various sectors Monetary Policy- the process by which the Federal Reserve controls the supply of money, often targeting a rate of interest for the purpose of promoting economic growth and stability. The official goals usually include relatively stable prices and low unemployment.
Key Terms: Fallacy- an argument that uses incorrect logic. These arguments sound plausible but are often misleading and deceptive. Deficit Spending- When annual government spending exceeds annual government revenue. Surplus- when annual government revenue exceed annual government spending. Debt- When the government runs deficits, they must pay for the shortfall by borrowing. The accumulation of deficit spending leads to debt.
Key People/Groups: Congress- Fiscal Policy is the responsibility of Congress. The Federal Reserve- Established in 1913, the Federal Reserve is responsible for developing and administrating the nation’s monetary policy. John Maynard Keynes- English economist that favored government interaction in the economy. Although he passed away in the 1940’s his ideas and writing have been extremely influential on how governments view their role with regards to economic issues. Considered the father of modern Macroeconomics. F.A. Hayek- Austrian born economist, was a key member of the Austrian School of Economics and opponent to Keynes. He believed that individual voluntarily decision and not force government decisions was the best way to allocate scarce resources to their most useful place. Milton Friedman- An economist and advocate of reduced government. Economic best known for his money-supply rule.
Important Documentsand outside readings: • Keeping Score • What is seen and What is not Seen • Keynes vs. Hayek raps • Websites: • Bureau of Economic Analysis http://www.bea.gov/ • Bureau of Labor Statisticshttp://www.bls.gov • http://www.bls.gov/bls/inflation.htm
Introduction: Every night we turn on the news and we get reports on the status of our economy. Some say our economy is growing while others say it is stagnant. We hear politicians debate about what needs to be done and who should do it. On one news station we hear that a proposed economic program is just what the doctor ordered while on another station we hear that if the same program was implemented it would lead to an economic disaster. The various ideas and positions can lead to an extremely unclear picture of what is truly going on. Up to this point we have looked at the economy through scope of the individual, firm, or specific markets (called microeconomics), now we will take a step back and look at the entire economy also know as the aggregate market (called macroeconomics). Just as the government can influence individual markets, the government can also influence the macro economy or the total economy. But as with all trade-offs there are cost and benefits that must be considered. As with other decisions nothing acts in isolation, the unseen is just as important as the seen. So, how would you assess the strength of our economy today? Is it healthy? Is it weak? Is it growing or is it shrinking? Maybe you don’t know. But how would you find out? Think about when someone goes to the doctor for their annual healthy check-up. The doctor checks the patient’s blood pressure, listens to their breathing, checks their height and weight and conducts other tests. Do these test tell the doctor everything about the patient? Of course not, but they do serve as indicators or signs that give the doctor a sense of the patient’s general health.
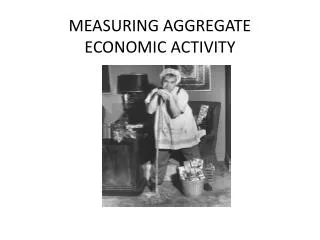
Economist also use indicators to assess the over-all health of the economy. There are many indicators that help economist develop an understanding of the economy but the three that we will focus on are; Gross Domestic Product, Unemployment rate, and Inflation rates. Gross Domestic Product (GDP): Gross Domestic Product is the market value for all final goods and services produced within a country during a given period of time. G.D.P. is the number one indicator that economist speak about when they discuss the health of the economy. As with any statistic, GDP can be a little misleading but generally speaking a growing GDP is a sign of a healthy economy and a higher standard of living and a shrinking GDP is an indicator of a weak economy. As mentioned, GDP counts all final goods, a final good is a good that is ready for consumption such as a car, cereal, and houses. An intermediate good is a good that is used in the product of final goods such as wood, steel, and rubber. Intermediate goods are not counted so that double counting can be avoided. For example, we wouldn’t count the sale of steel to a car manufacture because later when that steel is part of the produced car, we would be counting it twice. In addition to intermediate goods, financial assets are not counted because they don’t reflect current production. Also second hand goods are not counted because they also don’t reflect current production.
"Gross" means that GDP measures production regardless of the various uses to which that production can be put. Production can be used for immediate consumption, for investment in new fixed assets or inventories, or for replacing depreciated fixed assets. "Domestic" means that GDP measures production that takes place within the country's borders. How do we calculate GDP? There are various methods that economist use to calculate GDP. In this curse we will focus on the expenditure method. The thought process behind the expenditure method is that products are created to be sold. By adding together spending throughout a year we can get a sense of the total production of the nation. GDP is the sum of the following components.: GDP (Y)= C + I + G + (X-M) Private Consumption: this is usually the largest component of GDP. This is the total expenditures of households. They include both durable goods (last longer such as a car) and non-durable goods (short term such as food). Housing is not included. (I) Business Investments: this includes building a new factory or purchasing new equipment. It does not mean buying stock, that is classified as savings. Additionally, buying a new home is also included in investments
(G) Government Spending: includes government purchases of final goods and services such as weapons, roads, and salaries for public officials. It does not include spending on programs such as unemployment benefits or social security. (X-M) Exports – Imports: X (exports) represents gross exports. GDP captures the amount a country produces, including goods and services produced for other nations' consumption, therefore exports are added. M (imports) represents gross imports. Imports are subtracted since imported goods will be included in the terms G, I, or C, and must be deducted to avoid counting foreign supply as domestic.
When GDP is measured in today’s prices it is called the nominal GDP. Due to inflation nominal GDP’s are often higher than real GDP measurements. Below is a map from the CIA that shows the nominal GDPs of different nations. Nominal GDP may give us a sense of how different nations compare to each other but there are other variables such as population that need to be considered. For example, compared to Israel, India has a much higher GDP yet the poverty rate is much higher in India than it is in Israel.
By dividing a nation’s GDP with its population we get the GDP per capita. This gives us a better sense of how the standard of living of individuals in each nation compare. Below is a map from 2012 that shows the nominal GDP per capita
If we want to compare a nation with itself, a better indicator than nominal GDP is real GDP. Real GDP has been adjusted for inflation. Economist do this by using a base year’s value of the dollar. The chart above shows both the nominal and real GDPs of the United States. The base year is 2005. Notice after 2005, both real and nominal increased however the real GDP did not grow as fast as the nominal. The difference can be attributed to inflation.
Here is a different way of looking at nominal GDP vs. real GDP. In 1939, the classic movie Gone with the Wind earned $32 million dollars in the box office. To many it is considered the number 1 film of all-time. Jump ahead to 2012, Silver Lining Playbook (a pretty good film) earned over $100 million dollars. The point being that inflation (which you’ll read about later) can have a significant impact on numbers. There are some important correlations involving GDP. Correlation does not mean causation but it is interesting to note that nations with higher GDPs tend to have higher literacy rates, lower infant morality, better health and longer life spans. GDP does not measure standard of living however is it used as an indicator. There are some flaws to GDP. For example, GDP does not account for all production such as unpaid work, informal exchanges, and illegal activity. It counts negatives such as war and hurricanes as positives. It does not take into account externalities such as pollution. Additionally, GDP does not take into account the time it may have taken to create the product. Or in other words, it accounts for benefits but not cost. Others claim that it is too simplified and that it cannot possibly measure real standards of living because it does not take into account income distribution.
Another concern about GDP is the fact that governments may have an incentive to increase the GDP by increasing their spending. But of course the money comes from taxpayers. Some argue that to gain a more accurate picture of the economy any GDP statistic must include the percent of government spending. Economist Frank Shostak argues in his paper, “What’s up with the GDP?” that GDP is an empty abstraction devoid of any link to the real world, and, therefore, has little or no value in economic analysis. According the Shostak, “The GDP framework cannot tell us whether final goods and services that were produced during a particular period of time are a reflection of real wealth expansion, or a reflection of capital consumption. For instance, if a government embarks on the building of a pyramid, which adds absolutely nothing to the well-being of individuals, the GDP framework will regard this as economic growth. In reality, however, the building of the pyramid will divert real funding from wealth-generating activities, thereby stifling the production of wealth. So what are we to make out of the periodical pronouncements that the economy, as depicted by real GDP, grew by a particular percentage? All we can say is that this percentage has nothing to do with real economic growth and that it most likely mirrors the pace of monetary pumping. We can thus conclude that the GDP framework is an empty abstraction devoid of any link to the real world.” Please summarize Shostak’s argument.
According to Milton Friedman, “Spending isn’t good, what is good is producing. What we want to have is more goods and services. Government spending is ok for those things, those services that we believe that we can get more usefully and more effectively through government. If people are getting their money’s worth- fine. That’s why it is very desirable to have government expenditures occur as much at the local level as possible, because you as a citizen of a local community can judge if you are getting your money’s worth and you can decide if you want to spend it. But when it comes to the federal government you tend to think that you are spending someone else’s money. In a way you are, but he is spending yours.” It is important to note that standards of living only improve when there is real wealth production. Other methods of calculating GDP may take this into account.
And according to Senator Robert Kennedy in 1968, "The Gross National Product includes air pollution and advertising for cigarettes, and ambulance to clear our highways of carnage. It counts special locks for our doors, and jails for the people who break them. GNP includes the destruction of the redwoods and the death of Lake Superior. It grows with the production of napalm and missiles and nuclear warheads... And if GNP includes all this, there is much that it does not comprehend. It does not allow for the health of our families, the quality of their education, or the joy of their play. It is indifferent to the decency of our factories and the safety of our streets alike. It does not include the beauty of our poetry or the strength of our marriages, or the intelligence of our public debate or the integrity of our public officials... GNP measures neither our wit nor our courage, neither our wisdom nor our learning, neither our compassion nor our devotion to our country. It measures everything, in short, except that which makes life worthwhile; and it can tell us everything about America - except whether we are proud to be Americans." Please summarize Senator Kennedy’s critique of GDP.
On another note, you may have noticed that Senator Kennedy used the term GNP and not GDP. GDP refers to production within a nation’s borders. Gross National Product (GNP) refers to production based on ownership and is not restricted by borders. So if an American company produced a product in Thailand it would not count toward GDPof the United States, but it would count toward the GNP of the United States. Please use only 6 words to summarize GDP. Additionally use the site below to look up the GDP of our last 4 quarters. http://www.bea.gov/ Supplemental Reading Keeping Score by Charles Wheelan Pay close attention to the paragraphs about GDP.
Unemployment rate: • The unemployment rate is another key indicator of the health of the economy. High employment rates signify an unhealthy economy. The bureau of labor statistics conducts random surveys to acquire the unemployment rate. • In terms of employment status there are three classifications: • Employed- members of the labor force who have jobs. • Unemployed- members of the labor force who do not have jobs but are looking for jobs. • Not in the labor force- those who are eligible to be in the labor force but don’t have jobs and are not looking for jobs. This includes full time students, disabled, retired, and those prevented by family responsibilities. The labor force is found by adding all employed and unemployed workers together. To find the unemployment rate the BLS divides the unemployed by the labor force and multiples the number by 100. number unemployed Unemployment rate = ______________________________ X 100 number in labor force
In June of 2013 there were 155, 835,000 in the U.S. labor force. 144,058,000 were employed and 11,777,0000 people who were unemployed. What was the unemployment rate in United States in June of 2013? 11,777,000 unemployed Unemployment rate = ________________________ = 155,835,000 in the labor force 7.6% In June of 2011, the unemployment rate was above 9.0%, since then it has been steadily dropping
Economic downturn is a major contributor to the unemployment rate, however economist recognize that there are other reasons beside a weak economy that may cause a person to be unemployed. For example, economist claim that some unemployment is a natural consequence of changing economies. The natural rate of unemployment (NRU) is about 4.5%, so when a nation’s unemployment rate falls to 4.5% the economy is said to be operating at full employment. Reasons for natural unemployment: Frictional unemployment- When a person first enters the workforce after graduation or if a person leaves a job to find a better job that person is said to be frictionally unemployed. Structure/Technological unemployment- Some products or skills become obsolete and as a result the jobs needed to create those products or that utilize those skills also become obsolete. Therefor the supply of labor exceeds the demand for that labor. Workers leave the field to develop new skills so that they can enter new fields that are more useful to society.
Seasonal unemployment- is an extension of structural unemployment in the sense that there are some jobs that have higher demand during specific periods of the year. For example, there really isn’t much demand for a life guard on the Ocean City beach in the dead of winter. And most shopping malls don’t employ a Santa in the middle of August. There are other reasons for unemployment that can be attributed to struggling economies. Cyclical (Keynesian) unemployment- occurs when there is less demand for products. People lose their jobs, consequently they have less money to spend resulting in lower aggregate demand and more job loss. Often governments intervene to try to stop the downward spiral. Classical unemployment- Although debatable, classical economist believe that some unemployment results from inflexible wages that exceed the equilibrium price resulting in more labor being supplied than demanded. Additionally unemployment benefits remove the incentive to quickly find new work thus extending periods of unemployment.
As mentioned before the natural rate of unemployment is 4.5% to 5% any number above that is most likely attributed to cyclical reasons. By looking at the unemployment rates over a period of years we can trace the health of the economy over time. Another way that economist classify unemployment is voluntary or involuntary. Friction unemployment is considered voluntary and to a degree so is structural. Structure in the sense that some people opt to stay in field that they know will be outdated. Seasonal can also be viewed as voluntary unemployment. Cyclical is involuntary and this is where the government directs its attention. When we experience unemployment rates above 4.5% it can be a sign of current or past struggles.
Economic cost of Unemployment Lost of potential output.- labor is a natural resource, and when we have a lot of people not working we are wasting an important natural resource. According to economist Melvin Okun, as a rule of thumb a 1 percent increase in unemployment will result in a 2 percent decrease in GDP. Later in this unit we will see how economic policies are developed based on the premise that employment and GDP growth are tied together. Loss of income by workers- Unemployed workers experience a loss of income and as a result the economy sees a reduction in both spending and savings. Additionally, long periods if unemployment take from potential retirement nest.
There are additional negative economic outcomes of unemployment. • The loss of government revenue- The unemployed do not contribute to taxes and in fact usually collect unemployment insurance. • Economic drag- If the number of unemployed becomes too large, money from other programs must be shifted to unemployment programs or taxes are raised on those who have jobs.
As with GDP, unemployment gives us a good indication of the health of the economy but it is not perfect, it also has its flaws. For starters, unemployment does not count discouraged workers or in other words those who have given up looking for work. Some say that if we counted these people in the unemployment calculations the our real unemployment rate is 17%. It also doesn’t count marginally attached people who are not working, not looking for jobs, but have indicated that they would like a job. Additionally, involuntary part-time workers are not counted as part of the unemployment rate. These are the people who would like full time jobs but can only get part-time hours. They are partially employed. For example, lets say a former salesman who made over $100, 000 a year, loses his job. To make ends meet and to stay busy he picks up 2 part time jobs that pay him just above minimum wage. To that individual he is not better off but according to the data , he lost one job but gained 2, a net of plus 1 in the job creation tally. Regardless of length, citizens are also counted as “employed” if they did any work for pay or profit during the survey week. Also unpaid family workers are also considered employed.
The 2012 chart below show the number of unemployed workers but it takes into account alternative measures of labor underutilization. How does labor underutilization hurt of economy? What would you do to lower the unemployment rate?
Another issue with unemployment rates is that generally when we hear about the unemployment rate it is the national unemployment rate. This rate may prompt the government to “do something” but the unemployment rate is not uniform. Employment rates vary across states, cities, and professions. This is natural, if one state is suffering from a large unemployment rate then they should look to see what other successful states are doing. All professions experience ups and downs, but not all at the same time. The fallacy of composition refers to the error of thinking that what is true for individual parts must be true for the whole. Blanket laws used to lower unemployment in one sector of the economy or area of the nation can have adverse effects on other. Caution must be used.
Another common error that politicians utilize is to simply create jobs to lower unemployment but not to be productive. For an economy to grow production matters. Below is an idea that Bill Clinton and the mayor of New York City both support. Would you pay to have someone paint your roof white? Why or why not? What percent of your neighbors do you think would pay to have their roofs painted white? Would you support legislation to have the government create a “paint your roofs white” program? Why or why not. To solve unemployment why doesn’t the government just give people $10,000 and a shovel and tell them to dig ditches and then fill them back in.?
Inflation rate: Before we get into inflation rates, lets review money. Remember, anything can serve as money. The following items have served or continue to serve as money today in specific places. Remember money serves as a. . .1. Medium of exchange- transactions are easier to conduct 2. Store of value- you can trade money at anytime. You can sell your crops now and buy something a year later- long after your crops have rotted. 3. Measure of value- Money does not have any intrinsic value it only measures value. Gold Salt Brass Rings Sea Shells Toys Crocodile Tobacco
Use what you know about money to answer the following questions. 1. If tobacco served as money predict how tobacco farmers would respond.2. Joe is stranded on an island made of gold. Joe dies in a week- why?3. You live in a society where there is no money. You mow lawns in the summer, would it be more or less difficult to trade a mowed lawn for a book bag? Why?4. "they are taking our money" is a common argument from anti-trade advocates. What is the flaw of this argument. Hint: what is the answer for question 2. 5. You are stranded on a deserted island and a brief case of a million dollars falls from the sky, are you now richer? Why or why not? 6. Imagine if the mythical cities of gold did in fact exist and the Spanish conquistadors were able to find these cities and ship all of the gold back to Spain. What would have happened to prices in Spain and in Europe? Would the Spanish have been richer?
Inflation Rate: Inflation rate refers to the rate at which the general level of prices for goods and services is rising, and, subsequently, purchasing power is falling. Since money itself has no intrinsic value its purchasing power can fluctuate. The inflation rate is the percent of increase in the average price level of goods and services from one month or year to the next. In general prices and wages rise usually at rate of about 2-4%. Since 1914 the average annual rate of inflation has been about 3.4%. But why do prices rise? There are 3 basic explanations for an increase is price Demand-Pull: This occurs when the demand becomes larger than the current supply. If prices don’t rise the supply will sell out. Consumer competition leads to higher prices. There are various causes of demand pull. a. A growing economy- As people work more and have more money they spend more. Additionally, there is an expectation of future inflation (future higher prices) so consumers are incentivized to buy more now. b. Government fiscal policy- When the government lowers taxes they create more able and willing consumers and when the government increases spending they also increase demand C. New Technology- can change markets
Cost – Push: This occurs when the cost of resources increases. There are various causes of cost-push. a. Price of Resources- When the resource price increases suppliers must raise prices to stay in business. The price of oil is an example of a resource that can have a large impact on the economy. Other argue that labor wages increases inflations. Some economist argue that the cost-push does not exist, that instead the cost-push is merely a reaction to the demand pull and changes in monetary supply. b. Government involvement- Regulations, price controls such as minimum wage, tariffs, and taxes and subsidies all have an impact on cost An over-expansion of the money supply: According to Milton Friedman, “Inflation is always and everywhere a monetary phenomenon.” To Friedman and others, inflation occurs because there is excessive money supply created by the federal reserve. The money supply is not just cash, but also credit, loans and mortgages. When loans are cheap, then there will be too much money chasing too few goods, creating inflation. The prices of just about everything will increase, even though neither demand nor supply has changed. Or in other words, when the quantity of money exceeds the quantity of goods and service that are produced. The truth is inflation in the United States is made in one place and one place alone, the printing presses of the federal reserve. - Milton Friedman
Economist who believe that excessive money supply is the main cause of inflation use the following equation to support their claim. MV= PQ M- Money Supply V- Velocity of Money (how many transactions are made.) P- Price level Q- Quantity of goods and services (output) If the money supply increases and velocity and Quantity produced (output) have stayed the same, then what must happen to price in order for the equation to remain equal? If the money supply increases at a rate that is higher than the increase in GDP, we will see an increase in price.
How is inflation measured? Inflation is measured by using a price index. A price index measures the average change in price of a type of good over time. The Consumer Price index (CPI) is a price index for a “market basket” of consumer goods and services. The CPI is determined by consumer and store surveys. After the current average price is determined it is compared to a base period. The based period that is used is 1982-1984. Changes in the average prices of these items approximate the change in the cost of living. Therefore CPI is also known as the Cost of living index. Research theories that attempt to explain why inflation rates seem to have skyrocketed starting in the early 1970’s.
The following is a hypothetical example of how CPI is determined.
Limitations of CPI as a measure: As with any statistic there are limitations to using CPI to measure inflation. Substitution Bias- People buy substitutes if prices are too high. CPI doesn’t take this into consideration. Outlet/Discount store bias- CPI doesn’t take into account that people may buy goods at a discount store. Acme- average price of a chicken fryer (small whole Chicken)- $7.41 Bottom Dollar – same item or similar item- $4.00 New Product bias Mobile phones in 1983- $3995, 1998 $200- but mobile phones were not included in the CPI until 1998. Quality change bias- technological improvements make items better and last longer.
Inflation and Standard of Living: In its most basic sense, time is a measurement of value. Inflation results from an increase in prices and wages. And price and wage is a measure of time. But, how does that impact us and our standard of living? As French economist Frederic Bastiat pointed out, “we work to live not live to work.” The opportunity cost of work is leisure. Think about the following scenario: Johnny works as a landscaper in 1996 and he makes $10 perhour. He decides to buy a movie ticket for $5.00. We can say that he traded a half hour of his time for the movie ticket. If in 2013, Johnny still makes $10 perhour but the movie ticket now cost $10. He now has to trade a full hour of his time for the movie ticket. When we speak about cost of living we generally speak in terms of the nominal cost of living which is the cost in current dollars of the basic good and service that people need. But when we attempt to compare different time periods we need to speak in terms of the real cost of living. The real cost living is the nominal cost of basic goods and services that have adjusted for inflation. .
The same holds true for wages, nominal wages are wages based on current prices, while real wages are nominal wages that have been adjusted for inflation. We often hear about the good old days when prices were significantly lower. We have all heard an elder say, “back in my day it only cost 10 cents to go to the movies.” That is true but how much money did people make? Wages need to keep up with the cost of living if the standard of living is to remain the same. “The cost of living is indeed going up—in money terms. What really matters, though, isn't what something costs in money; it's what it costs in time. Making money takes time, so when we shop, we're really spending time. The real cost of living isn't measured in dollars and cents but in the hours and minutes we must work to live.” – Report of the Dallas Federal Reserve 1997 American essayist Henry David Thoreau (1817-62) noted this in his famous book, Walden: "The cost of a thing is the amount of. . .life which is required to be exchanged for it, immediately or in the long run."
Thankfully, our standard of living is improving. Take a look at the 1897 prices of products offered by Sears. Wow!!! Imagine only paying $13.50 for a telephone. But if you take a look at the 1997 equivalent price a telephone would cost $1,202.23. That means the amount of time that it would take to make $13.50 to buy a phone in 1897 is equal to the amount of time that it would have taken to make $1,202.23 in 1997. For our landscaper Johnny it would take about 120 hours or 3 full-time work weeks. Look at other examples, Would you spend $66.00 dollars on scissors? Or $11.58 for one pair of socks? If you take a look at the bike it is possible that someone may spend $2000 on a bike but how do you think the quality would compare to a bike make in 1897?
Wages need to keep up with the cost of living if the standard of living is to remain the same. But what happens if they don’t? Lets take a look at some former and current salaries of Presidents. Presidential salaries are not linked to increases in inflation. Imagine an extreme case. As you can see from the chart, Washington’s $25,000 salary in 1789 was equivalent to $321,863 in 2011. Imagine if there was constitutional amendment outlawing an increases to the President’s salary starting with Washington. Obviously, $25,000 has less purchasing power today.
Excessive inflation hurts everybody, but who is hurt the most by inflation? Lenders- When they get the their money back it isn’t worth as much, therefore they must charge interest to adjust for inflation. But inflation rates are hard to predict. Those on fixed incomes.- What someone receive in Social Security in 1990 doesn’t go as far in2014. If incomes don’t adjust, their standard of living will fall. People who save their money. I’ll save today to buy tomorrow but tomorrow’s prices are higher than today. The uncertainty over higher prices makes efficient economic decisions more difficult to make.
If wages don’t keep up with inflation rates than there will be a problem!!! Wages usually don’t produce inflation, they usually try keep up with inflation. As a result inflation takes from everybody until their wages adjust. Extreme cases such as hyperinflation (inflation where increases are severe and quick) can destroy entire nations. Imagine living in a country where if you ate breakfast at a café your second cup of coffee would cost more than the first cup. Or living in a nation where people insisted on being paid in the morning so they could shop during lunch, because they knew that prices would double by dinner time. Excessive inflation can and has sent nations into a tailspin. Inflation rates can speed up and slow down but they are always a positive number. Deflation is when average prices drop. This sounds good but it can actually be worse than inflation, in fact depressions usually follow deflationary periods. The reason being that when prices drop, suppliers stop producing and layoff workers.
Use what you know about inflation to answer the following questions: Inflation scenarios 1. Larry borrowed $5000 from Ronnie in 1955. Ronnie pays it back in 2005.. Why has inflation benefitted the borrower or in other words why has it hurt the lender?2. Jan is retired and receives a monthly check of $2000 dollars from social security. How will inflation impact her life in the future?3. Sally makes 50,000 dollars in her first year of work and is scheduled to make $51,000 the next year. During that period of time the inflation rate was 4% , has her standard of living improved? Why or why not?4. In 1960, Mark bought a house for $16,000. He made no improvements but sold it in 2013 for $300,00, how did this happen? 5. Perhaps a better way of looking at inflation is to ask how much time does it cost to make a chicken dinner? Why? 6. Why do some economist consider inflation that is caused by an increase in money supply a hidden tax? 7. Individually we are all responsible for inflation. Agree or disagree?
The business cycle: The business cycle is the pattern of expansion, contraction and recovery in the economy. Generally speaking, the business cycle is measured and tracked in terms of GDP and unemployment – GDP rises and unemployment shrinks during expansion phases, while reversing in periods of recession. Wherever one starts in the cycle, the economy is observed to go through four periods – expansion, peak, contraction and trough. Recession is typically used to mean a downturn in economic activity, but most economists use a specific definition of "two consecutive quarters of declining real GDP" for recession. By comparison, there is no formal definition of depression. While recessions have averaged around 10 months in length since the 1950s, the recovery/expansion phases have a much wider range of lengths, though around three years is relatively common. The movement of the economy through business cycles also highlights certain economic relationships. While growth will rise and fall with cycles, there is a long-term trend line for growth; when economic growth is above the trend line, unemployment usually falls. One expression of this relationship is Okun's Law, an equation that holds that every 1% of GDP above trend equates to 0.5% less unemployment.The relationship between inflation and growth is not as clear, but inflation does tend to fall during recessions and then increase through recoveries.
Look up the following data for the United States over the last 4 quarters. GDP, Unemployment rate, and inflation rate. Where are we on the spectrum?
The name business cycle makes it sound like the cycle is very predictable but the opposite is true. Peaks and Trough are extremely difficult to predict. The leading indicators are GDP, Unemployment, and Inflation but there other indicators such as housing construction. It is also sometimes hard to know exactly where we are on the cycle because some indictors such as unemployment rates are what economist call lagging indictors. Lagging indictors are indictors that manifest themselves after the economy has already begun to change. But what causes contraction and what causes growth? What causes the dip? A Negative shock to the economy such as rapidly rising oil prices, stock market crash, uncertainty with regards to government actions, terrorist attacks Increase in interest rates making it more difficult to borrow money. When supply is prevented from meeting demand – natural or man-made Some say an increase in savings leads to an increase in inventories. Increased inventories force firms to cut back production and layoff workers. Other claim that irresponsible actions during the boom such as irresponsible lending and borrowing, increased money supply, and misallocation of resources cause dips that are more severe.
What causes Growth? Confidence in market caused by knowledge- uncertainty is the worst enemy. Increased production causes firms to hire, which then increases demand New technology- think 1990’s internet. Increases in supply- supply creates its own demand. Government?????? While the business cycle is a relatively simple concept, there is great debate among economists as to what influences the length and magnitude of the individual parts of the cycle, and whether the government can (or should) play a role in influencing this process. Keynesians, for instance, believe that the government can soften the impact of recessions (and shorten their duration) by cutting taxes and increasing spending, while also preventing an economy from "overheating" by increasing taxes and cutting spending during expansion phases.In comparison, many monetarist economists disagree with the notion of business cycles altogether and prefer to look at changes in the economy as irregular (non-cyclical) fluctuations. In many cases, they believe that declines in business activity are the result of monetary phenomena and that active government inflation is ineffective at best and destabilizing at worst.