Download
1 / 44
440 likes | 521 Vues
Understand how to monitor chemical factors in water and identify their impacts on living organisms. Learn about biological and microbiological indicators, chemical monitoring techniques, and common chemical factors affecting water quality.

E N D
The quantity of chemicals in the environment can be monitored Topic 2
Government learning outcomes • When you have completed this section, you will be able to: • Describe and illustrate the use of biological monitoring as a method of determining environmental quality • Identify chemical factors in the environment that might affect the health and distribution of living things • Apply and interpret measures of chemical concentration in parts per million, billion or trillion
Monitoring Water Quality Section 2.1
Monitoring • Monitoring: keeping track of something for a specific purpose • In this section, we’ll talk about ways of monitoring as a method of determining environmental quality
Monitoring Water Quality • Clarity may be one indicator, but clear water does not indicate what chemicals are present. • Water Quality is determined using chemical and biological indicators according to what the water is going to be used for.There are five categories of water use: • • human drinking water• recreation• livestock drinking water• irrigation• protection of aquatic life
Biological Indicators • Scientists use organisms that live in water to help determine water quality. • If certain organisms are dying off, scientists know that their required conditions are not being met. • Possible required conditions • Certain pH levels • Certain temperatures • Certain levels of dissolved oxygen
Microbiological Indicators • Microscopic organisms (bacteria) can cause serious health problems if they are present in sufficient numbers. • Samples are taken to identify their presence to avoid contamination of the water supply. • Water treatment may be necessary if they are found in water supplies
Aquatic Invertebrate Indicators • Invertebrates: Animals without a backbone • Species of invertebrates require certain conditions to survive. • The presence of these indicate healthy living conditions.
Aquatic Environments • A pond that supports a wide variety of organisms probably has good water quality for allowing organisms to survive. • However, it cannot be considered safe for humans to drink until it is tested further to make sure.
Chemical Factors that Affect Organisms • Pure water is made up of only H2O molecules, but water in the environment is never completely pure. • The following are most commonly monitored as indicators of water quality • Dissolved oxygen • Acidity • Heavy metals • Nitrogen • Phosphorous • Pesticides • Salts – such as NaCl and Mg3(SO4)2
Measuring Chemicals in the Environment • The concentration of chemicals in the environment is usually measured in parts per million (ppm) or milligrams per liter
Parts per Million/Billion/Trillion • Parts per million (ppm) • Parts per billion (ppb) • Parts per trillion (ppt)
Dissolved Oxygen • Rapids expose more water surface to the air than smooth river flow does. The turbulence allows more oxygen from the air to dissolve in the water.
Factors Affecting Dissolved Oxygen Levels • Abiotic Factors • Temperature • Turbulence due to wind or the speed of moving water • The amount of photosynthesis by plants and algae • Biotic Factors • The number of organisms using up the oxygen
Phosphorous and Nitrogen Content • Sources: • Sewage outfalls and runoff from fertilized fields • Problems with High Concentrations: • Algae and plants grow and die. The extra food helps bacteria thrive. The extra bacteria consumes the dissolved oxygen. The decreased levels of dissolved oxygen causes fish and aquatic insects to die. • http://www.youtube.com/watch?v=UGqZsSuG7ao • Animation ( 1 minute)
Acidity • Causes of Acid Rain • Problems • As acidity , plant and animal diversity • Spring Acid Shock: acid builds up in snow and ice. When it melts in the spring, aquatic systems are quickly affected. The eggs of aquatic organisms as well as young offspring are potentially killed.
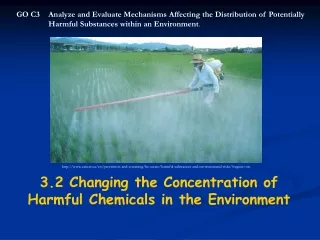
Pesticideshttp://video.msnbc.msn.com/nightly-news/47379683#473796832 minutes • Sources of Pesticides: • Farmers and agriculture • Problems: • Some insects have become pesticide-resistant – new pesticides are being developed. • These chemicals can combine with other chemicals to create toxins (poisons). • Even though many pesticides are designed to be broken down by bacteria after one growing season, they still remain in the tissues and therefore, in the environment.
Measuring Toxicity • Toxins: substances that produce serious health problems or death when introduced into an organism. • Measurement of toxcity: LD50 • LD represents “lethal dose” • 50 represents 50% • LD50 is the amount of a substance that causes 50% of a group of test animals to die if they are given a specified dose of the substance all at once
LD50 Table • Notice that as the toxicity of the substance increases, the LD50 decreases. Per unit of body mass The dose that would lead To death
Heavy Metalshttp://www.youtube.com/watch?v=wd8djXPrbhg&feature=related7 minutes • Mercury Poisoning causes • Numbness of arms and legs • Involuntary movements • Nerve damage • Brain damage • How is Mercury Poisoning caused? • Eating foods containing mercury • Fish shouldn’t be eaten out of the Bow River below Calgary because the fish contain mercury.
Heavy Metals • Heavy Metals: Metals with a density of 5g/cm3 or more. • Examples: copper, lead, zinc, mercury, cadmium, nickel. • Everyday items containing heavy metals: batteries, rubber tire, gasoline, paints, pipes, thermometers, and some fertilizers.
Heavy Metals • Heavy metals can be toxic to a wide range of organisms, including humans, so water quality monitoring includes checking concentrations of heavy metals. • Usually, large amounts of heavy metals are not readily available in the environment for uptake by plants or ingestion by animals. • Acid rain can cause lead in pipes to dissolve • Cadmium in certain fertilizers can be taken in by plants and eaten by animals and/or humans. • Heavy metal lead is especially harmful to children It can affect normal development and cause brain damage.
Assignment • Parts Per Million/Billion/Trillion
Monitoring Air Quality Section 2.2
Air • The air you breathe is made up of • Nitrogen (78%) • Oxygen (21%) • Argon (less than 1%) • Carbon dioxide (0.03%) • Hydrogen (traces) • Neon (traces) • If air quality is poor, you will also breath in other substances.
Air Quality • Air quality can be determined in two ways: • By measuring the levels of pollutants in the air • By estimating the amount of emissions from pollution sources • Monitoring chemicals in the air over a period of many years provides information about seasonal variations, as well as long term trends. • http://www.youtube.com/watch?v=P1nta1DOfHM(8 minutes)
Pollutants • Sulfur oxides • Sources: industrial processes (oil and gas industry) • Forms: smog and acid rain • Affects: respiratory system and eye irritation
Pollutants • Nitrogen oxides • Sources: combustion from vehicles, in generating plants, from oil refining • Forms: smog and acid rain • Affects: respiratory system and eye irritation
Pollutants • Carbon monoxide • Sources: combustion from vehicles, wood, natural gas, industrial processes, airplanes, and cigarette smoking • Affects: If inhaled, CO reduces the amount of oxygen carried by the blood. It causes headaches, sleepiness, chest pains, brain damage and death. • Protection: catalytic converters in vehicles and industries convert carbon monoxide into the less harmful carbon dioxide.
Ground Level Ozonehttp://www.youtube.com/watch?v=WKrPd-8CJBM(10 minutes) • Ozone (O3) is an odourless, colourless gas • Uses: protects us from harmful ultraviolet rays from space • Danger: At ground-level it can be harmful, because it can affect the respiratory system, deteriorate plastics and can have serious effects on crops. • Sources: Ground-level ozone forms from reactions between oxygen, nitrogen oxides and compounds that are volatile organic compounds(VOC’s), in the presence of sunlight and heat. Fuel combustion is the major source.
Assignment • Measuring Nitrogen Oxides
Monitoring the Atmosphere Section 2.3
Carbon Dioxide as a Greenhouse Gas • Carbon dioxide isn’t technically considered a pollutant, but it still can have negative effects if not monitored.
The Greenhouse Effect • Life on earth thrives because we live in a natural greenhouse. Some gases in the atmosphere act like the glass in a greenhouse. They trap heat from the Sun’s radiant energy. This heat keeps Earth at temperatures that allow living things to live, grow, and reproduce. • Greenhouse Gases: water vapour, carbon dioxide, methane and nitrogen oxides.
The Greenhouse Effect • When radiant energy from the sun reaches Earth’s surface, much of it is reflected back into space. But some of this energy is trapped near Earth’s surface by a layer of gases that act like glass in a greenhouse.
The Enhanced Greenhouse Effect • Human activities are contributing to an enhanced greenhouse effect. • Burning fossil fuels, clear cutting trees • If the amount of gases are increased, the gases trap in more heat. • The resulting temperature increase is called Global Warming. • http://earthguide.ucsd.edu/earthguide/diagrams/greenhouse/ step by step animation
The Enhanced Greenhouse Effect • Human Activities are generating more greenhouse gases, so many scientists have concluded that more heat is being trapped. This means that Earth’s surface temperature will continue to rise. This worldwide increase is called global warming.
Global Warming • Causes: human activities, volcanic eruptions, forest fires • Results: more violent natural disasters, flooding in coastal areas from increased icecap melting, greater ranges in the spread of diseases • Prevention: windmill farms, tree planting, alternative sources of energy
Ozone Layer • Ozone layer: a layer of O3 to shield Earth from UV radiation. • Risk of losing ozone? • Skin damage • Cancer • Why? • Ultraviolet radiation is entering our atmosphere
The Role of Chlorofluorocarbons (CFCs) • CFCs are used in refrigerators, aerosol cans, and fire extinguishers. • They move into the upper atmosphere where UV radiation breaks them down. The resulting chlorine gas destroys ozone. • Many countries have now signed international agreements to reduce their use of these chemicals. • http://www.youtube.com/watch?v=AU0eNa4GrgU&feature=related • (16 minutes)
Stuff Happens with Bill Nye: Dinner (discovery education) 15 minutes