Random Errors
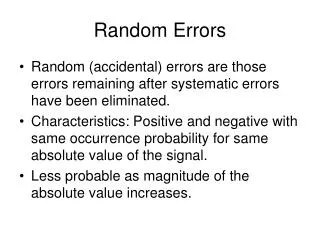
Random Errors. Random (accidental) errors are those errors remaining after systematic errors have been eliminated. Characteristics: Positive and negative with same occurrence probability for same absolute value of the signal. Less probable as magnitude of the absolute value increases.

Random Errors
E N D
Presentation Transcript
Random Errors • Random (accidental) errors are those errors remaining after systematic errors have been eliminated. • Characteristics: Positive and negative with same occurrence probability for same absolute value of the signal. • Less probable as magnitude of the absolute value increases.
Random Errors • Approaches zero as the number of measurements increase. • For a given measurement method, random errors do not exceed a fixed value. If random errors do exceed a fixed value, that experiment should be repeated and studied separately.
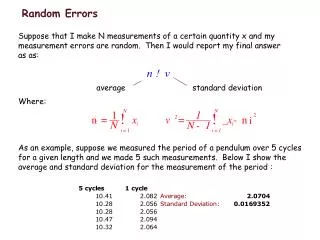
Random Errors • Random errors imply one measures n times to have a set of x (datum) that can be averaged (xn) . If the set of values is finite then each average is different. The averages follow a Gaussian Distribution • Having a variance of σ2/n and σ2 is the variance of x. • Confidence interval for x is xn – uncertainty ≤ x ≤ xn + uncertainty
Random Errors • And the uncertainty is k times the square root of the variance or : kσ/√n One can obtain k from the tables of the normal Gaussian Distribution tables. The confidence interval has a probability of Conf. Interval Probability = 1 – α where α is also found from the Gaussian Distribution tables.
Random Errors • The normalized Gaussian Distribution is shown at the following site: http://www.itl.nist.gov/div898/handbook/eda/section3/eda3661.htm In normalized functions, the total probability is 1. So 1-α is the total probability minus the “tail” of the Gaussian Distribution.
Random Errors • See Example 1.2 page 19 of the text.