Download

1 / 29
290 likes | 318 Vues
Learn about the importance of reliability, properties of random errors, and composite scores in psychological measurements. Explore implications of random errors on measurement quality and ways to aggregate multiple observations to reduce errors.

E N D
Reliability, the Properties of Random Errors, and Composite Scores Lecture 7, Psych 350 - R. Chris Fraleyhttp://www.yourpersonality.net/psych350/fall2012/
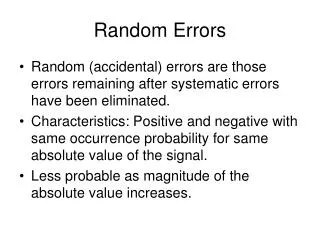
Reliability • Reliability: the extent to which measurements are free of random errors. • Random error: nonsystematic mistakes in measurement • misreading a questionnaire item • observer looks away when coding behavior • response scale not quite fitting
Reliability • What are the implications of random measurement errors for the quality of our measurements?
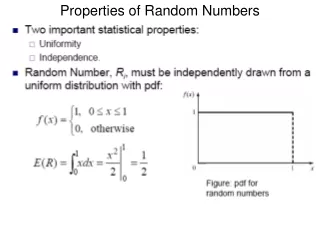
Reliability • O = T + E + S O = a measured score (e.g., performance on an exam) T = true score (e.g., the value we want) E = random error S = systematic error • O = T + E (we’ll ignore S for now, but we’ll return to it later)
Reliability • O = T + E • The error becomes a part of what we’re measuring • This is a problem if we’re operationally defining our variables using equivalence definitions because part of our measurement is based on the true value that we want and part is based on error. • Once we’ve taken a measurement, we have an equation with two unknowns. We can’t separate the relative contribution of T and E. 10 = T + E
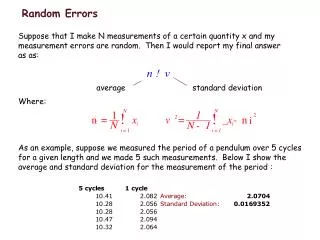
Reliability: Do random errors accumulate? • Question: If we aggregate or average multiple observations, will random errors accumulate?
Reliability: Do random errors accumulate? • Answer: No. If E is truly random, we are just as likely to overestimate T as we are to underestimate T. • Height example
Reliability: Do random errors accumulate? Note: The average of the seven O’s is equal to T
Composite scores • These demonstrations suggest that one important way to help eliminate the influence of random errors is to aggregate multiple measurements of the same construct. Composite scores. • use multiple questionnaire items in surveys of an attitude, behavior, or trait • use more than one observer when coding behavior • use observer- and self-reports when possible
Example: Self-esteem survey items • 1. I feel that I'm a person of worth, at least on an equal plane with others.Strongly Disagree 1 2 3 4 5 Strongly Agree2. I feel that I have a number of good qualities.Strongly Disagree 1 2 3 4 5 Strongly Agree4. I am able to do things as well as most other people. Strongly Disagree 1 2 3 4 5 Strongly Agree
Example: Self-esteem survey items • 1. I feel that I'm a person of worth, at least on an equal plane with others.Strongly Disagree 1 2 3 4 5 Strongly Agree2. I feel that I have a number of good qualities.Strongly Disagree 1 2 3 4 5 Strongly Agree4. I am able to do things as well as most other people. Strongly Disagree 1 2 3 4 5 Strongly Agree Composite self-esteem score = (4 + 5 + 3)/3 = 4
Two things to note about aggregation • Reverse Keyed Items • Some measurements are keyed in the direction opposite of the construct of interest. High values represent low values on the trait of interest.
Example: Self-esteem survey items • 1. I feel that I'm a person of worth, at least on an equal plane with others.Strongly Disagree 1 2 3 4 5 Strongly Agree2. I feel that I have a number of good qualities.Strongly Disagree 1 2 3 4 5 Strongly Agree3.All in all, I am inclined to feel that I am a failure.Strongly Disagree 1 2 3 4 5 Strongly Agree4. I am able to do things as well as most other people. Strongly Disagree 1 2 3 4 5 Strongly Agree5. I feel I do not have much to be proud of. Strongly Disagree 1 2 3 4 5 Strongly Agree Inappropriate composite self-esteem score = (5 + 5+ 1 + 4 + 1)/5 = 3.2
Reverse keying: Transform the measures such that high scores become low scores and vice versa. • Example: Self-esteem survey items • 1. I feel that I'm a person of worth, at least on an equal plane with others.Strongly Disagree 1 2 3 4 5 Strongly Agree2. I feel that I have a number of good qualities.Strongly Disagree 1 2 3 4 5 Strongly Agree3.All in all, I am inclined to feel that I am a failure.Strongly Disagree 1 2 3 4 5 Strongly Agree4. I am able to do things as well as most other people. Strongly Disagree 1 2 3 4 5 Strongly Agree5. I feel I do not have much to be proud of. Strongly Disagree 1 2 3 4 5 Strongly Agree Appropriate composite self-esteem score = (5 + 5+ 5 + 4 + 5)/5 = 4.8
A simple algorithm for reverse keying in SPSS or Excel New X = Max + Min - X • Max represents the highest possible value (5 on the self-esteem scale). Min represents the lowest possible value (1 on the self-esteem scale).
Cautions: Two potential problems with aggregation • Example: stress Person Heart rate Complaints Average/composite A 80 2 41 B 80 3 42 C 120 2 61 D 120 3 62
Cautions: Two potential problems with aggregation • Example: stress Person Heart rate Complaints Average/composite A 80 2 41 B 80 3 42 C 120 2 61 D 120 3 62 • The first problem is that the metric for the composite doesn’t make much sense. • Person A: 2 complaints + 80 beats per minute • = 41 complaints/beats per minute???
Two things to note about aggregation • Second, the variables may have different variances. • If this is true, then some indicators will “count” more in the average than others.
Example: stress Person Heart rate Complaints Average/composite A 80 2 41 B 80 3 42 C 120 2 61 D 120 3 62 The correlation between the composite and HR is .99. The correlation between the composite and Complaints is .05. Beats per minute Number of complaints
Two things to note about aggregation • One common solution to these problems is to standardize the variables before aggregating them. • Constant mean and variance
Variables with a large range/variance will influence the composite score more than variable with a small range. Standardization helps solve this problem. Person Heart rate(z) Complaints(z) Average A -.87 -.87 -.87 B -.87 .87 0 C .87 -.87 0 D .87 .87 .87 The correlation between the composite and HR is .71. The correlation between the composite and Complaints is .71.
Reliability: Estimating reliability • Question: How can we quantify the reliability of our measurements? • Answer: Two common ways: (a) test-retest reliability (b) internal consistency reliability
Reliability: Estimating reliability • Test-retest reliability: Reliability assessed by measuring something at least twice at different time points. Test-retest correlation. • The logic is as follows: If the errors of measurement are truly random, then the same errors are unlikely to be made more than once. Thus, to the degree that two measurements of the same thing agree, it is unlikely that those measurements contain random error.
r = .27 r = .92
Reliability: Estimating reliability • Internal consistency: Reliability assessed by measuring something at least twice within the same broad slice of time. Split-half: based on an arbitrary split (e.g, comparing odd and even, first half and second half). Split-half correlation. Cronbach’s alpha (): based on the average of all possible split-half correlations.
The reliability of the composite (a) increases as the number of measurements (k) increases. In fact, the reliability of the composite can get relatively high even if the items themselves do not correlate strongly. Ave r = .50 Ave r = .25 Ave r = .10
Ave r = .10 Ave r = .10
Reliability: Final notes • An important implication: As you increase the number of measures, the amount of random error in the averaged measurement decreases. • An important assumption: The entity being measured is not changing. • An important note: Common indices of reliability range from 0 to 1—in the metric of correlation coefficients; higher numbers indicate better reliability (i.e., less random error).