Download
1 / 22
220 likes | 370 Vues
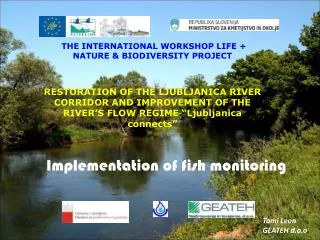
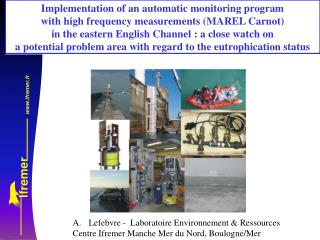
Implementation of an automatic monitoring program with high frequency measurements (MAREL Carnot) in the eastern English Channel : a close watch on a potential problem area with regard to the eutrophication status. Lefebvre - Laboratoire Environnement & Ressources

E N D
Implementation of an automatic monitoring program with high frequency measurements (MAREL Carnot) in the eastern English Channel : a close watch on a potential problem area with regard to the eutrophication status • Lefebvre - Laboratoire Environnement & Ressources • Centre Ifremer Manche Mer du Nord, Boulogne/Mer
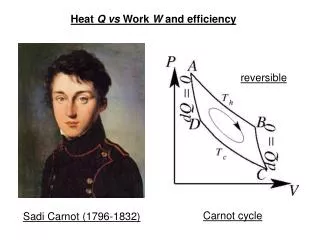
Once upon a time …Preliminary studies December 2001 – April 2002 Hydrology : main biological and physico-chemical parameters Courantology : ADCP Lefebvre A. , Repecaud M., Facq J.-V., Lefebvre G. & B. Hitier, 2002. Projet d’implantation de la station De mesures automatisées MAREL dans le port de Boulogne sur mer - Mesures in situ et résultats du modèle d’advection-diffusion Mars 2D. Rapport Ifremer DEL/BL/RST/02/07, 51 pages. Hébert C. & A Lefebvre, 2004. Circulation des masses d’eau dans la rade de Boulogne sur Mer. Étude préalable à l ‘implantation de la station de mesures automatisées MAREL Carnot. Rapport Ifremer DEL/BL/RST/04/08, 18 pages.
Location of the system Sea wall « CARNOT » MAREL Carnot English Channel Harbour
UnderstructureInstallation of thetube :12 m high, 2 m diameter et 15 t. End of the installation (18/12/2003) Building site
Instrumentation The tube and the buoy The buoy
Studied parameters Seawater Temperature Air temperature Conductivity Relative Humidity pH P.A.R. (Photosynthetically Active Radiation) Turbidity Nitrate Dissolved oxygen Phosphate Chlorophyll (Fluorescence) Silicate Frequency : 1 series / 20 minutes (to be adjusted if special needed)
Main characteristics of the studied parameters January February March April May June Paramètres physico-chimiques Range Uncertainty Temperature % données acquises 75,6 75,9 69,1 - 5 à + 30 °C 94,8 95,6 0,1 °C 94,0 Conductivité 0 à 70 mS/cm 0,3 mS/cm July August September October November December Dissolved oxygen 0 à 20 mg/L 0,2 mg/L % données acquises 93,9 83,8 93,7 92,8 91,6 86,8 PH 6,5 à 8,5 UpH 0,2 UpH Turbidity 0 à 4000 NTU 10 % Fluorescence 0 à 50 FFU 10 % Nitrate 0,1 à 100 µmol/L 5 % Phosphate 0,1 à 100 µmol/L 5 % Silicate 0,1 à 100 µmol/L 5 % Monthly percentages of acquire data in 2008.
Access to data Quality Assurance on data series Dedicated web page Free data and reports available on http://www.ifremer.fr/difMarelCarnot/
Expected results • Improvement of the knowledge on the dynamic of a coastal system • under marine and anthropogenic controls • Region Of Freshwater Influence (ROFI) + riverine inputs • Occurrence of regular and intense blooms of the foaming and noxious Prymnesiophyceae Phaeocystis globosa Eutrophication = Nutrient inputs + excessive algal growth + harmful consequences
Results Usual monitoring strategy: SRN Network* (monthly/bi-monthly frequencies) The bloom in 2008 !? Well-fitted with the seasonal cycle but … * Regional Nutrient Monitoring Network (Ifremer / Artois-Picardie Water Agency)
Results Fluorescence 2008 - MAREL Carnot The same bloom with HF measurements !
Nutrients and phytoplanktonic dynamics Nitrate Phosphate Silicate Fluorescence February – May 2007 According to the objectives : ! Elementary knowledge on time scale ! (In Babin et al, 2008 - modified from Dickey 1991)
Nutrients and phytoplanktonic dynamics Silicate Uptake of silicate by Diatoms Fluorescence March 2006 Complementarity between MAREL Carnot & S.R.N. : information on phytoplanktonic community involved
Nutrients and phytoplanktonic dynamics Salinity Nitrate Silicate Fluorescence February– May 2007 Early nutrient inputs => contribution to the main bloom
Nutrients and phytoplanktonic dynamics Salinity Nitrate Silicate Fluorescence February – June 2006 Late nutrient inputs => secondary blooms : noxious diatoms or flagellates ?
Role of the ammonium during the bloom Results from the S.R.N. In progress : Implementation of the CHEMINI system (CHEmical MINIaturized analyser)
Effect of the sampling strategy on fluorescence distribution and his P90 • Use of 4 filters on the 2005-2007 database: • diurnal (7-19 h); • diurnal et operationnal (Monday to Friday) ; • diurnal et March-October ; • diurnal, operationnal et March-October. • Control on sampling frequency: • Monthly ; • F1 : monthly then bi-monthly in March-april and September-October; • F2 : monthly then bi-monthly from March to May and from August to October; • Bi-monthly ; • Weekly. • => BOOTSTRAP methodology applied for a given year (study of the annual variability) then for 6 years (WFD management plan)
Effect of the sampling strategy on fluorescence distribution and his P90 P90 for simulated fluorescence for a 6 years management plan with diurnal and operationnal data, and for monthly, bi-monthly and weekly sampling frequencies => Good assessment of the P90
Effect of the sampling strategy on fluorescence distribution and his P90 P90 for simulated fluorescence for a 6 years management plan with diurnal and operationnal data from March to October, and for monthly, F1, F2, bi-monthly and weekly sampling frequencies => Over-estimation of the P90
MAREL Carnot and satellite imagery: High frequency and meso-scale approach Sea Temperature: Marel Carnot vs. Pathfinder data February 2007 to February 2008 Access to data via the Nausicaa browser within 24 h Water Framework Directive context : chlorophyll, turbidity, sea surface temperature To be continued (offshore and ecosystemic approach) : Marine Strategy Framework Directive
THANKS FOR YOUR ATTENTION Usual sampling conditions ! Who want to sample from a 5 meters long boat ? Thanks to the MAREL TEAM Michel Repecaud Renaud Vuillemin Karenn Bucas David Le Pivert Loïc Quémener Jean-Valery Facq Vincent Duquesne Camille Blondel 10 meters MAREL Carnot