Download

1 / 23
250 likes | 619 Vues
Particulate Matter Air Pollution and Health Risks. What is Particulate Matter?.

E N D
Particulate Matter Air Pollution and Health Risks
What is Particulate Matter? Particulate matter (PM) describes a wide variety of airborne material. PM pollution consists of materials (including dust, smoke, and soot), that are directly emitted into the air or result from the transformation of gaseous pollutants. Particles come from natural sources (e.g., volcanic eruptions) and human activities such as burning fossil fuels, incinerating wastes, and smelting metals. Image from http://www.epa.gov/eogapti1/ module3/distribu/distribu.htm
How is PM Regulated? PM is one of the six EPA “criteria pollutants” that have been determined to be harmful to public health and the environment. (The other five are ozone, sulfur dioxide, nitrogen dioxide, carbon monoxide, and lead.) EPA is required under the Clean Air Act to set national ambient air quality standards (NAAQS) to protect public health from exposure to these pollutants. Areas that exceed the NAAQS are designated as nonattainment, and must institute air pollution control programs to reduce air pollution to levels that meet the NAAQS.
Where Does PM Originate? Sources may emit PM directly into the environment or emit precursors such as sulfur dioxide (SO2), nitrogen dioxide (NO2), and volatile organic compounds (VOCs), which are transformed through atmospheric chemistry to form PM. VOCs NO2 SO2 PM Ammonia (NH3) Ammonia (NH3)
Sources of PM and PM Precursors Stationary Sources (power plants, factories) NO2, SO2, PM Mobile Sources (vehicles) VOCs, NO2, PM Natural Sources (forest fires, volcanoes) PM Area Sources (drycleaners, gas stations) VOCs
Determinants of PM Concentration • Weather patterns • Wind • Stability (vertical movement of air) • Turbulence • Precipitation • Topography • Smokestack height and temperature of gases Nearby natural and built structures may lead to downward moving currents causing aerodynamic or building downwash of smokestack emissions.
The Role of Inversions An inversion is an extremely stable layer of the atmosphere that forms over areas. Temperature inversions trap pollutants close to the ground. These inversions involve layers of hot air sitting above cooler air near ground level. When particles accumulate in the air layer, they are unable to rise into the atmosphere where winds will disperse them. Source: http://www.epa.gov/apti/ course422/ ce1.html
Major Episodes of Severe Air Pollution due to Inversions 1930: Meuse River Valley, Belgium • An inversion led to a high concentration of pollutants during a period of cold, damp weather • Main sources: zinc smelter, sulfuric acid factory, glass manufacturers • 60 deaths recorded 1948: Donora, Pennsylvania • Similar inversion to Meuse River Valley • Main sources: iron and steel factories, zinc smelting, and an acid plant • 20 deaths observed 1952: London • Killer fog (right) • Primary source: domestic coal burning • 4,500 excess deaths recorded during week- long period in December The Great London Smog (1952)
Particulate Matter: Aerodynamic Diameter Establishing a particle size definition for irregularly shaped particles necessitates the use of a standardized measure referred to as the aerodynamic diameter, measured in microns or micrometers (μm), a unit equal to one millionth of a meter. The graph at the right shows the distribution of the 4 main particle size categories, with the categories historically and currently regulated by EPA indicated below. By comparison, a human hair is approximately 70 microns in diameter. Top: Modified from Online Reference Module by JR Richards et al. http://registrar.ies. ncsu.edu/ol_2000. Bottom: U.S. EPA. Office of Research and Development.
Particulate Matter: Size Matters Size is important to the behavior of PM in the atmosphere and human body and determines the entry and absorption potential for particles in the lungs. Particles larger than 10 mm are trapped in the nose and throat and never reach the lungs. Therefore, particles 10 mm in diameter or less are of most concern for their effects on human health. Particles between 5 and 10 mm are removed by physical processes in the throat. Particles smaller than 5 mm reach the bronchial tubes, while particles 2.5 mm in diameter or smaller are breathed into the deepest portions of the lungs. Image: PM2.5. By D. Hershey. From New York State Department of Environmental Conservation. http://www.dec.state.ny.us/website/dar/baqs/micro/two.html
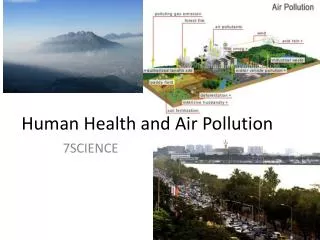
What Adverse Health Effects Have Been Linked to PM? • Premature death • Lung cancer • Exacerbation of COPD • Development of chronic lung disease • Heart attacks • Hospital admissions and ER visits for heart and lung disease • Respiratory symptoms and medication use in people with chronic lung disease and asthma • Decreased lung function • Pre-term birth • Low birth weight
Increasing Evidence of Cardiovascular Effects Until the mid 1990s, most research focused on the association of PM exposure with respiratory disease. Since then, there has been growing evidence of cardiovascular health effects from PM. Source: Pope and Dockery, JAWMA, 2006
Toxicological,clinicaland epidemiological studies have increased understanding of the mechanism of action by which PM leads to mortality and lung and heart disease. For example, at right are stained photomicrographs of abdominal arteries from mice exposed to filtered air and air polluted with fine particulate matter, with the increased arterial blockage in the PM-exposed mice providing scientific support for the link between PM and atherosclerosis found in a study of human subjects (Kunzli et al., 2005). Integrating Toxicology, Epidemiology and Clinical Studies Sun et al. JAMA, 2005
Several theories have been advanced as to the mechanism of action. It is likely that more than one mechanism is involved in causing PM-related health effects. Theories include the following: PM causes inflammationof lung tissue, resulting in the release of chemicals that impact heart function; PM causes changes in blood chemistrythat results in clots that can cause heart attacks. How Does PM Cause Health Effects? • PM leads to lung irritationwhich leads to increase permeability in lung tissue; • PM increases susceptibility to viral and bacterial pathogensleading to pneumonia in vulnerable persons who are unable to clear these infections; • PM aggravates the severity of chronic lung diseasescausing rapid loss of airway function;
Types of Air Pollution and Health Studies • Ecologic study – Examines the association between exposure rates and disease rates in a group over time. In ecologic studies, the exposure and disease status of individuals in the group are unknown. Therefore, one limitation of this study design is that those exposed and those with the disease may not be the same individuals. • Time-series study – Analyzes a series of data points that results from repeated measurements over time. Adjustments are made for cyclical or seasonal trends such as daily peaks in PM levels or annual influenza trends in order to identify larger trends that demonstrate the association between exposure and disease. • Cohort study – The health status of individuals in a cohort (i.e., group of study participants) whose exposure status is known at the start of the study is monitored over time to see if there is an association between their exposure and particular health outcomes.
The Evolution of Air Pollution Research Methods - Early Studies Early studiesofair pollution concentrated on the severe episodes described earlier. These episodes demonstrated a clear link between increased levels of ambient pollution and adverse health outcomes. Methods used to describe these events included population surveys, ecological studies, and, later, time-series analyses. Donora, PA at noon on Oct. 29, 1948. Photo source: Pittsburgh Post-Gazette
The Evolution of Air Pollution Research Methods - The London Fog The London Fog event of 1952 provides a clear example of an early time-series analysis. The figure to the right shows the estimates of weekly mortality and average sulfur dioxide concentrations for London during the winter of 1952-53. Deaths in December increased approximately 2.5 times over comparable periods in 1947 to 1951, and remained elevated through February 1953. Source: http://www.portfolio.mvm.ed.ac.uk/ studentwebs/session4/27/greatsmog52.htm
The Evolution of Air Pollution Research Methods - Modern Studies The modern era of air pollution research involved using laboratory sampling equipment and epidemiologic methods to determine personal exposures and to monitor health effects. These efforts were used in the Harvard Six Cities Study, a prospective study pioneered in 1973, in which mortality data from a cohort of adults in six cities with different levels of air pollution were analyzed, controlling for behavioral risk factors such as smoking. This study led to more complex techniques for both measuring exposure and modeling the exposure-response relationship between PM and health endpoints. P=Portage, WI H=Harriman, TN T=Topeka, KS L=St. Louis, MO W=Watertown, MA S=Steubenville, OH Source: Dockery D, et al. An Association between Air Pollution and Mortality in Six U.S. Cities, NEJM 1993; 329 (24):1753-1759.
The Evolution of Air Pollution Research Methods - Multiple Sites More recent studies have introduced sophisticated statistical approaches to the time-series relationship. The National Morbidity, Mortality, and Air Pollution Study (NMMAPS) has made substantial contributions towards understanding the association of PM with mortality by applying a consistent approach to data collected at 90 different sites across the nation. The graph at the right shows the relative rates of mortality per 10 μg increase in PM10 levels for the 90 individual study sites. Source: Samet JM, Zeger SL, Dominici FD et al. 2000. The National Morbidity, Mortality, and Air Pollution Study. Part II: Morbidity and Mortality from Air Pollution in the United States. Cambridge, MA: Health Effects Institute.
Air Pollution Research: Setting the Future Agenda The Committee on Research Priorities for Airborne Particulate Matter was established by the National Research Council in January 1998 in response to a request from Congress and the EPA. The Committee produced 4 reports over the period 1998 – 2004. I. Immediate Priorities and a Long-Range Research Portfolio II. Evaluating Research Progress and Updating the Portfolio IV. Continuing Research Progress III. Early Research Progress
Research Priorities The Committee identified ten research areas of priority in establishing the relation between PM exposure and public health: • Outdoor measures vs. actual human exposure • Exposures of susceptible subpopulations to toxic PM components • Characterization of emission sources • Air-Quality-Model development and testing • Assessment of hazardous particulate matter components • Dosimetry: Deposition and fate of particles in the respiratory tract • Combined effects of PM and gaseous co-pollutants • Susceptible subpopulations • Mechanisms of injury • Analysis and measurement
For More Information Further information on particulate matter air pollution is available at: http://www.healtheffects.org/ http://www.epa.gov/oar/particlepollution/ http://www.epa.gov/ttn/naaqs/standards/pm/s_pm_index.html http://www.epa.gov/air/oaqps/greenbk/pindex.html