Download
1 / 26
260 likes | 390 Vues
Energy curves of solutions Having different Interaction energies between the two atoms. The simplest picture of the atomic structure of metallic crystals is one of spherical ions closely packed and existing in a ‘sea’ of conduction electrons .

E N D
Energy curves of solutions Having different Interaction energies between the two atoms
The simplest picture of the atomic structure of metallic crystals is one of spherical ions closely packed and existing in a ‘sea’ of conduction electrons. • A measureureof the interaction energy between ions in the lattice is the heat of vaporization of the element A, • And this interaction energy, V AA ,represents the work required to transfer an atom from the lattice to infinity.
Similarly, the interaction energy between atoms of an element B can be represented by the symbol V BB . • Since V AA, and V BB,are work done on the systems, • Interaction energies are negative quantities, • And the more negative they are the more stable phases. • For a solid solution alloy between the elements A and B, • The average interaction energy V AB between dissimilar atoms will depend upon the chemical nature of the two species.
If the two types of atom had similar chemical characteristics but slightly different interaction energies, ‘ • It is likely that the system would be ideal and • The interaction energy of the solution would be such that V AB =0.5 (V AA + V BB ). (no H change) • When the chemical nature of the constituent elements are dissimilar, • Two alternative cases of non ideality arise depending upon the magnitude of V AB relative to V AAand V BB.
-Ve deviation • If the interaction energy V AB<0.5 (V AA+ V BB) • The unlike bonds are preferred, (-vedeviation) • The energy (enthalpy) will be lowered by mixing • And the tendency for the formation of intermetallic compounds or ordered phases increases as V ABdecreases relative to 0•5(V AA + V AB).
+ve deviation • If V AB>0.5( V AA+V AA ) bonding between like atoms is energetically preferred (+vedeviation) • The average bond energy after mixing is less negative • Therefore enthalpy is raised by mixing • And a solid solution has a tendency to un-mix into more dilute solutions of the constituent elements.
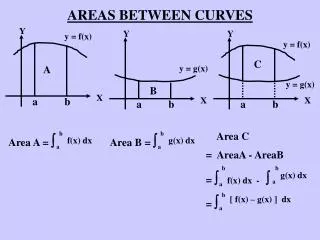
These three different situations are illustrated schematically in Figure 2.24 • The free energy of the solution is shown as a function of composition • For the case of ideal and the two cases of non-ideal behavior. • Such free energy curves are possible for both solid and liquid alloys.
It has also established that there is little or no interaction between the two types of atoms in liquid state or at higher temperature in the solid state • It is known that chemical potential was related to the activity or effective concentration of component A in the solution. • It can be shown that Ua (Chemical Potential) at concentration X=Xa is equal to the intercept at 100 % A of the tangent to the free energy curve at that point. • The graphical construction is given at Fig. 2.25a. • Thus the slope of the energy curve (dG/dx) determines the magnitude of the chemical potential. • .
If two phases’ alpha and beta are present in equilibrium, • The equilibrium condition demands that the chemical potential of the component A is identical in the two phases. • This condition is only satisfied by the common tangent between the free energy curves of the two phases • And therefore the composition of the two phases in equilibrium is given by the point of tangency of the line to the two curves.
It also follows from this construction that microstructure of any alloy b/t the composition X-alpha and X-beta • Consist of the equilibrium phases alpha and beta in the appropriate ratio to the average alloy composition. • It is also kept in mind that stable phase or phase mixture at any temperature is that which has the lowest free energy.
Thus once the form of free energy curve is established as a function of T • The lower envelop of the free energy curve or the common tangent b/t them defines the phases present at any T.
Thus once the form of free energy curve is established as a function of T • The lower envelop of the free energy curve or the common tangent b/t them defines the phases present at any T. • This is shown in fig2.26 • Defines the phases present or the situation where two solid phases and a liquid phase are present isothermally across an equilibrium diagram.
By determining how the phase relationship change with temperature as the free energy curve displaced relative to each other , • The equilibrium diagram can be constructed. • Several examples are given blow. • The various constructions are, by and large, self .explanatory
Procedure for finding stable phase equilibrium in binary system where number of alternative phases is formed • The stable states for all compositions are described by the lowest possible envelop of the free energy curves and tangent lines fig. 2.8. • In fig 2.8 gamma and liquid are unstable at all compositions • And alpha is stable for A-rich mixture and beta is stable for B-rich mixture.
At all compositions between the point o tangency with the dashed line, mixture of alpha and beta are stable. • The alpha and beta always have compositions corresponding the point of tangency. • Of course situation changes with changing temperature. • If the temperature is high enough, • The free energy composition curves for the liquid will lie below all other curves and tangent lines.
Signifying that the stability of the liquid phase at all composition • If the relative positions of the free energy compositions curves for a binary system is known for a series of the temperature. • The stable phases or mixture of phases may be deduced immediately for each temperature.
These data may then be plotted in temperature-composition space. • This result in the familiar phase diagram which map out the region of the stability for each phase and phase mixture.
Single solid solution Equilibrium diagram • For two atomic species to form a series of solid solutions across the phase diagram, • The basic requirement are that their crystal structure be identical and there other phiysicaland chemical properties be similar. • Thus the free energy curve of both the liquid and solid phases will be approximately ideal and similar to that shown in Figure 2.24(b). • The relative positions of the free energies curves of both the phases are shown in Figure 2.27(a)—(e) for five different temperature and equilibrium diagram construction is given in Figure 2.27(f)
At temperature T1 the liquid phase has the lower free energy across the whole of the composition range • And therefore the liquid phase is the stable phase at this temperature on the equilibrium diagram. • At temperatures T2, T3 and T4 the free energy curve intersect and a common tangent can be constructed between the curves , • The range of compositions delimited by the points of tangency defines the solid plus liquid phase field ,
Whilst the separate solid and liquid phase fields are determined by the curves beyond the range of the common tangent. • At temperature T5 the lowest possible free energy of any alloy is given by the free energy curve of the solid, • And therefore at this temperature the binary system must comprise a complete range of solid solution. • Examples of this type of phase diagram are Ni—Cu, Ag—Au, and Ge-Si
Complete Miscibility in the Liquid State, Restricted Miscibility in the Solid te at Low Temperatures • Figure2.28 shows the free energy curves and equilibrium diagram for the situtiononly slightly different from the example given above. • In this case the shape of the liquidus and solvus lines of the equilibrium diagram are similar to shown in Figure 2.27, • But decomposition of the single solid solution takes place at lower temperatures.
The reason for this is that the interaction energy between theatoms at temperatures above Tcis • Such that V AB> 0.5 (V AA + V BB ), • So the thermal energy of the lattice is sufficient to keep the atoms completely intermixed • But at a temperature around Tcthe free energy curve of the solid develop a maximum as shown in figure 2.28 d and 2.28e • At less then Tc the atoms form into clusters in which one or the other atomic species has a higher concentration than average. • This type of behavior is found in the Au-Ni system
But at a temperature around Tcthe free energy curve of the solid develop a maximum as shown in figure 2.28 d and 2.28e • At less then Tc the atoms form into clusters in which one or the other atomic species has a higher concentration than average. • This type of behavior is found in the Au-Ni system