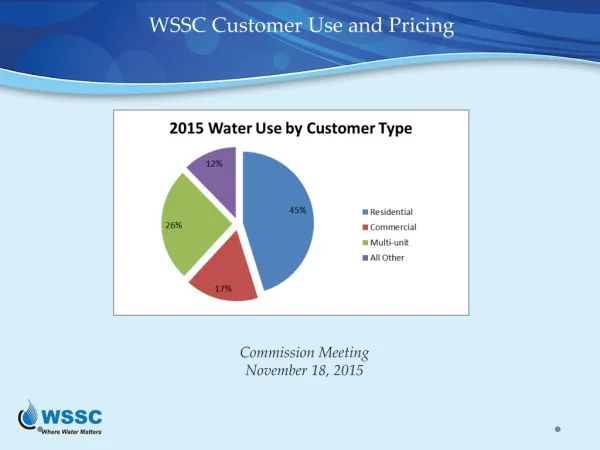
Download
1 / 39
390 likes | 612 Vues
Intense Attribution Period (IAP) November 2009 - April 2010. Outline for Today’s Call Interannual Variability in CPC Fcst Skill °CPC/Arun Kumar Lead The U.S. 2009 Summer Cold ° ESRL/Marty Hoerling/XiaoWei Quan Lead Impacts of Sea Ice Loss ° ESRL/Judith Perlwitz/Marty Hoerling Lead.

E N D
Intense Attribution Period (IAP) November 2009 - April 2010 Outline for Today’s Call Interannual Variability in CPC Fcst Skill °CPC/Arun Kumar Lead The U.S. 2009 Summer Cold ° ESRL/Marty Hoerling/XiaoWei Quan Lead Impacts of Sea Ice Loss ° ESRL/Judith Perlwitz/Marty Hoerling Lead Second Meeting November 18 2009
Assessing Causes for Interannual Variability in CPC Seasonal Forecast Skill
Background • Seasonal forecasts for surface temperature and rainfall over the US are made since 1995 (~15 year history); • Official forecast is a blend of various tools : empirical (trend; CCA; MLR) and dynamical (the CFS); • Forecasts are for anomalous probability for the tercile categories. Forecast map also includes “Equal Chance (EC)” for locations where there is no a prior reason to tilt climatological probability; • Dynamical forecasts based on the CFS are also available for the same period. The CFS does not have time varying CO2 (although SSTs are initialized, and to some extent, do carry the trend information)
Forecast Format CFS Forecast Official Forecast
Analysis • Spatial and temporal variability in skill (for JFM 1995 – DJF 2008) • Skill comparison between the official CPC and the CFS forecast • Skill is evaluated based on the Heidke Skill Score (HSS) over all grid points. HSS is basically a measure of correct forecast hits relative to random guess
Relevance? • Different methods have predictive skill from different sources • CFS: initial conditions, skillful prediction of boundary forcings (SST, soil moisture, sea-ice, snow…), trends, something else we have not even thought about (but is there in the model); • Operational: ENSO, trends, soil moisture, subjective knowledge base; • Differences and commonality in skill provide some information about the sources (and their importance) for prediction skill; • Predictability/prediction skill & attribution for the causes for climate variability are tightly linked; • Provide explanations for our successes and failures.
Spatial Variability Winter Summer
Sfc Temp: Contingency Table OBS OBS Forecast Forecast CPC CFS
Southwest US Skill Trend
Rainfall CFS CPC
In addition • Include AMIP simulations in attribution assessments for the sources of predictability
Warm Summer/Fall Globally…. But What’s Up with North America?
More Record High Temps? From Meehl et al. 2009 (GRL, in press) “Even in the first nine months of this year, when the United States cooled somewhat after a string of unusually warm years, the ratio of record daily high to record daily low temperatures was more than three to two.”
The Summer Warming Hole That Won’t “Mend” ° Five of the 5 Warmest Central US Summers Happened Before 1970 ° Three of the 5 Coldest Central US Summers Happened After 1970
El Niño Impact on June-October U.S. sfcT Simulated June-Oct sfcT anomalies forced by composite El Niño SSTs
June-October U.S. sfcT OBS 2009 Model refers to conditions forced by composite El Niño SSTs
June-October U.S. sfcT OBS El Niño Composite Model refers to conditions forced by composite El Niño SSTs
June-October U.S. sfcT OBS El Niño Composite (Incl. 2009) Model refers to conditions forced by composite El Niño SSTs
PDF of Model Simulations for Central US SfcT June-October Model refers to conditions forced by composite El Niño SSTs
Sea Ice Depletion: 2007 Record Low What Are the Attributable Impacts?
Spring 2009 - Initial Conditions 18 April 2007 These maps show the areas of multi-year (MY) sea ice (white) estimated from QuikSCAT for April 2007, May 2008 and May 2009. Courtesy of Son Nghiem, JPL/NASA. Ice Conditions during the spring of 2009 showed a much smaller area of older, thicker MY sea ice compared to spring 2007, favoring a possible new record minimum. For more details, see http://www.arcus.org/search/seaiceoutlook/2009_outlook/2009_pan-arctic_summary.php. Courtesy of Ignatius Rigor
Summer Wind Forcing • June, July: SLP/Wind fields (top) favored the export of sea ice out of the Arctic Ocean into the GIN seas. Sea Ice Extent was lower than 2007 and 2008 during same period (right). • However, wind forcing inhibited retreat during August and September. • 2009 was the third lowest minimum on record (2008 = 2nd, 2007 = 1st) Courtesy of Ignatius Rigor
Age of Sea Ice in September 2009 • Age of sea ice in September 2009 estimated from ice drift and summer minimum ice extent. Updated from Rigor & Wallace 2004. • Although ice conditions during spring favored an extensive retreat of sea ice, a significant area of first-year (FY) sea ice survived the summer retreat. • Some questions that can be asked: What happens to the heat that was absorbed by the ocean during summer? Where does the heat go during the growth of ice over the large expanses of open water and thinner sea ice? Courtesy of Ignatius Rigor
From Holland et al. 2007 GRL from NSIDC, Fowler and Maslanik Oct 2009
Sea Ice and SfcT Anomalies NCEP SfcT Anomalies (2003-07) from Serreze et al. 2009 (The Cryosphere)
Determine the Impact of Sea Ice Conditions on 2007 Climate ° Force AGCM with the specified monthly varying sea ice and SSTs of 2007 ° Force AGCM with only the specified monthly SSTs, but monthly CLIMO sea ice ° Perform large ensemble in order to estimate the SfcT signal due to sea ice ° Perform multi-model simulations in order to determine robustness of sensitivity
Simulated Impact of the 2007 Sea Ice Conditions on NH Polar SfcT
Simulated Impact of the 2007 Sea Ice Conditions on NH Polar Heights