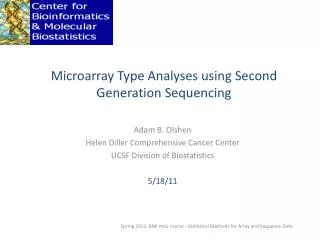
Microarray Type Analyses using Second Generation Sequencing
Microarray Type Analyses using Second Generation Sequencing. Adam B. Olshen Helen Diller Comprehensive Cancer Center UCSF Division of Biostatistics 5/18/11. Outline. RNA DNA Methylation. RNA. RNA Sequencing Pipeline. Experiment. Map Reads. Summarize Counts. Millions of short reads.

Microarray Type Analyses using Second Generation Sequencing
E N D
Presentation Transcript
Microarray Type Analyses using Second Generation Sequencing Adam B. Olshen Helen Diller Comprehensive Cancer Center UCSF Division of Biostatistics 5/18/11 Spring 2011, BMI mini course - Statistical Methods for Array and Sequence Data
Outline RNA DNA Methylation
RNA Sequencing Pipeline Experiment Map Reads Summarize Counts Millions of short reads Normalize Counts Test for Differential Expression Analyze Gene List Stolen from D McCarthy via Terry Speed
Summarizing Counts Counts are typically binned to annotated exons, genes, or transcripts. Summarizing to unannotated regions is more difficult.
Normalization Normalization is the process in which components of experiments are made comparable before statistical analysis. It is important in sequencing as it was in microarrays! A couple issues in normalization are different sequencing depth (library size) and distributions of reads (long right tails).
Simple RPKM Normalization Proportion of reads: number of reads (n) mapping to an exon (gene) divided by the total number of reads (N), n/N. RPKM: Reads Per Kilobase of exon (gene) per Million mapped sequence reads, 109n/(NL), where L is the length of the transcriptional unit in bp (Mortazavi et al., Nat. Meth., 2008).
TMM Thought Experiment • Suppose samples A and B are sequenced to the same depth, say 9000 reads • 90 genes are expressed in A and B truly at the same level • 10 genes are expressed at high levels in B but not in A, and no other genes are expressed • Possible scenario • All 90 genes get about 100 reads for A • First 90 genes for B get about 50 reads, while the other 10 genes get about 450 reads each • It would appear that the first 90 are expressed twice as high in A as in B! • The reason for this result is that there is a fixed amount of sequencing real estate
TMM Solution Trim off the genes with extreme M values Compute scale factor from remaining genes Others normalize by 75th percentile (Bullard et al., BMC Bioinformatics, 2010)
Differential Expression • We may want to test for differential expression between/among conditions, disease types, etc. • Need a parametric test because few replicates (often 2 or 3 these days) • In a parametric test a statistical distribution is assumed for the test statistic (such as Gaussian) unlike nonparametric tests where ranks are used
Methods Based on Counts • For microarrays Gaussian-based methods are most common • Because sequencing data is counts, statistical distributions for discrete data are used • Relevant distributions are • Binomial distribution • Poisson distribution • Negative binomial distribution
Poisson Distribution • The Poisson probability mass function is Pr(N)=exp(-λ)λN/N!, for rate parameter λ • The mean and variance of a Poisson random variable is the same: λ • The consensus is that this model is appropriate for technical replicates but that biological replicates have extra variability.
Negative Binomial Distribution The negative binomial distribution is common when count data has variance significantly greater than its mean (overdispersed) The NB distribution has mean λ and variance λ + φλ; as φ goes to 0 it goes to a Poisson It is used to model biological replicates
Negative Binomial Methods Different dispersion (φ) for every gene – not enough data to estimates this Common dispersion (Robinson and Smyth, Biostatistics, 2008) – good, but does not include any gene level variability Moderated dispersion (Robinson and Smyth, Bioinformatics, 2007) – best, but hard to weight gene level vs common dispersion
The Test Say there are two classes, A and B, with counts for gene g of ZgA and ZgB Model the counts as NB taking into account the number of libraries sequenced, the size of those libraries, and the NB parameters λ and φ Test whether ZgA and ZgB are significantly different conditional on the total ZgA + ZgB
EdgeR-Robinson’s Methods R Package Normalization DE
RNA Seq vs Microarrays Mortazavi et al., Nature Methods, 2008
Copy Number by Sequencing Shen and Zhang, Stanford Statistics Technical Report
Complications of Copy Number by Sequencing Over what region should copy number be sampled? Microarrays sample at a fixed number of probes/SNPs Coverage is highly variable Potentially, a huge amount of computation
Copy Number by Sequencing Let μt represent a non-homogeneous Poisson process representing counts from a case. Let λt represent a non-homogeneous Poisson process representing counts from a control. Let p(t)= μt/(μt+λt). Look for changes in p(t).
SeqCBS Software The method of Shen and Zhang (Stanford Statistics Technical Report) for segmenting sequencing data is called SeqCBS An R package for doing the analysis can be found at CRAN (http://cran.r-project.org/)
What is Methylation? • ~ 70% of CpGs are methylated in mammals; CpGs are relatively rare • A small fraction of the genome, CpG islands, shows near the expected CpG frequency
CpG islands often overlap promoters (sites of transcriptional initiation) Definition of a CpG island (Gardiner-Garden M, Frommer M. CpG islands in vertebrate genomes. J. Mol. Biol. 1987 Jul 20;196(2):261-82): 1. GC content of 50% or greater 2. length greater than 200 bp 3. ratio greater than 0.6 of observed number of CG dinucleotides to the expected number Obs/Exp CpG = Number of CpG * N / (Number of C * Number of G), where N = length of sequence.
The DNA Methylome: 28,848,753 CpG sites (Rollins et al, 2006)
Current methods for genome-wide DNA methylation analysis • Bisulfite sequencing • Antibody- or affinity-based enrichment • Methyl-sensitive restriction enzymes Limitations: 1. only a small number of the ~28 M CpGs can be interrogated (no longer true!) 2. difficult to analyze repetitive sequences
Bisulfite Sequencing Xi and Li, BMC Bioinformatics, 2009
Enrichment and Restriction Enzymes Methyl DNA immunoprecipitation - sequencing (MeDIP-seq) higher read density at methylated regions Methyl-sensitive restriction enzyme – sequencing (MRE-seq) each read is a single unmethylatedCpG site higher read density at methylated regions 5MeC 5MeC MRE digestion 5MeC MeDIP-seq MRE-seq
Methylome Methods Comparison • Base resolution • Absolute quantitation • Higher cost/sample • 150bp resolution • Relative quantitation • Much lower cost/sample • Low resolution • Relative quantitation • Can be combined with enrichment methods • Shotgun bisulfite • Enrichment • Restriction Enzymes
Comparison of MethylC, RRBS, MeDIP, MeDIP, MBD Harris et al, NIH Roadmap Epigenome Consortium, Nature Biotechnology, Oct 2010
Things Learned from Whole Genome Methylation Studies Maunakea et al., Nature, 2010 5’ promoter regions of CpG island almost never methylated, while intragenic region can be Methylation of intragenic regions appears to involve alternative promoters
Things Learned from Methylation Studies of Cancer Aberrant methylation of promoter CpG islands can lead to gene silencing (before microarrays) More soon!
Whole Genome Methylation Data is Very Difficult to Analyze! • What is the proper scale: • CpG level • Bin level (how many bins?) • Adjacent CpGs or bins are correlated, but not as correlated as copy number where regional segmentation is possible • P-values from testing differences between conditions are correlated • Huge multiple comparisons problem (28m CpGs) • Come back next year for methods discussion
Comparison of MethylC, RRBS, MeDIP, MeDIP, MBD Harris et al, NIH Roadmap Epigenome Consortium, Nature Biotechnology, Oct 2010
References Mortazavi et al., Nat. Meth., 2008. http://www.nature.com/nmeth/journal/v5/n7/full/nmeth.1226.html Robinson and Oshlack, Genome Biology, 2010. http://genomebiology.com/2010/11/3/R25 Bullard et al., BMC Bioinformatics, 2010. http://www.biomedcentral.com/1471-2105/11/94 Robinson and Smyth, Biostatistics, 2008. http://biostatistics.oxfordjournals.org/content/9/2/321.short Robinson and Smyth, Bioinformatics, 2007. http://bioinformatics.oxfordjournals.org/content/23/21/2881.full Robinson et al., Bioinformatics, 2010. http://bioinformatics.oxfordjournals.org/content/26/1/139 Shen and Zhang, Stanford Statistics Technical Report, 2011. http://statistics.stanford.edu/~ckirby/techreports/BIO/BIO%20257.pdf Gardiner-Garden and Frommer, J. Mol. Biol., 1987. http://www.ncbi.nlm.nih.gov/pubmed/3656447 Rollins, Genome Res., 2006. http://www.ncbi.nlm.nih.gov/pubmed/16365381 Xi and Li, BMC Bioinformatics, 2009. http://www.biomedcentral.com/1471-2105/10/232 Harris et al., Nature Biotechnology, 2010. http://www.ncbi.nlm.nih.gov/pubmed/20852635 Maunakea et al., Nature, 2010. http://www.ncbi.nlm.nih.gov/pubmed/20613842