Download
1 / 21
230 likes | 1.46k Vues
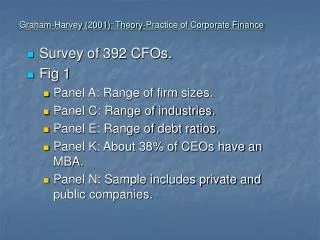
Graham-Harvey (2001): Theory-Practice of Corporate Finance. Survey of 392 CFOs. Fig 1 Panel A: Range of firm sizes. Panel C: Range of industries. Panel E: Range of debt ratios. Panel K: About 38% of CEOs have an MBA. Panel N: Sample includes private and public companies.

E N D
Graham-Harvey (2001): Theory-Practice of Corporate Finance • Survey of 392 CFOs. • Fig 1 • Panel A: Range of firm sizes. • Panel C: Range of industries. • Panel E: Range of debt ratios. • Panel K: About 38% of CEOs have an MBA. • Panel N: Sample includes private and public companies.
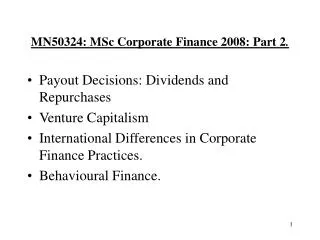
Graham-Harvey (2001): Theory-Practice of Corporate Finance • Fig 2: Popularity of different capital budgeting techniques (in order): • IRR • NPV • Hurdle rate • Payback • Large firms, highly levered firms, and firms with MBA-CEOs more likely to use NPV method.
NPV and IRR Security Market Line (CAPM) Accept Expected Return Reject Rf Beta
NPV and IRR Expected Return Accept IRR Cost of Capital Reject Beta
NPV and IRR Security Market Line (CAPM) A Expected Return B Cost of Capital C D Rf Beta A: CAPM (Accept), CoC (Accept) B: CAPM (Reject), CoC (Accept) C: CAPM (Accept), CoC (Reject) D: CAPM (Reject), CoC (Reject)
Graham-Harvey (2001): Theory-Practice of Corporate Finance • Fig 3: Popularity of different methods for calculating cost of equity capital (in order): • CAPM • Average historical return • Multibeta CAPM • Large firms, low levered firms, and firms with MBA-CEOs more likely to use CAPM.
Graham-Harvey (2001): Theory-Practice of Corporate Finance • Fig 5: Factors that CFOs thought determined the appropriate amount of debt (in order): • Financial flexibility (p. 218: minimizing interest obligations such that they do not need to shrink their business in case of an economic downturn). • Credit rating. • Earnings and cash flow volatility. • Insufficient internal funds. • Level of interest rates. • Interest tax savings. • Transaction cost and fees. • Equity misvaluation. • Comparable firm debt levels. • Bankruptcy/distress costs.
Graham-Harvey (2001): Theory-Practice of Corporate Finance • Fig 7: Factors that CFOs thought relevant in deciding whether or not to issue stock (in order): • Earnings per share dilution. • Stock misvaluation. • Recent rise in stock price. • Providing shares for employee/bonus stock option plans. • Maintaining target debt-to-equity ratio. • Diluting holding of certain shareholders. • Stock is least risky source of funds.
Graham-Harvey (2001): Theory-Practice of Corporate Finance • 5.1. Tradeoff theory of capital structure choice: Firms have optimal debt-equity ratios which they determine by trading off the benefits of debt (tax advantage of interest deductibility), with the costs of debt (financial distress costs, and tax expense incurred by bondholders). • Fig 5: Corporate tax advantage of debt only moderately important. • Fig 5: Financial distress moderately important. But credit rating may be a proxy for financial distress costs. • Fig 5: Personal tax considerations appears to be not important.
Graham-Harvey (2001): Theory-Practice of Corporate Finance • 5.2. Asymmetric information explanations of capital structure choice: • 5.2.1 Pecking-order theory: Firms do not target a specific debt ratio, but instead use external financing only when internal funds are insufficient: External funds are less desirable because informational asymmetries between management and investors imply that external funds are undervalued. Hence, if firms use external funds, they prefer to use debt, convertible securities, and, as a last resort, equity. • Table 9: Consistent with the pecking-order theory : Having insufficient internal funds is a moderately important influence on the decision to issue debt, especially for smaller firms (that are likely to suffer from greater asymmetric-information-related equity undervaluation).
Graham-Harvey (2001): Theory-Practice of Corporate Finance • 5.2. Asymmetric information explanations of capital structure choice: • 5.2.2 Recent increase in stock price: A surge in share price increase can correct an undervaluation or lead to an overvaluation. • Table 8: Recent stock price increase third most important factor in equity-issuance decision. • 5.2.4 Convertible debt issuance: Conversion feature makes convertible debt relatively insensitive to asymmetric information (between management and investors) about the risk of the firm. • Table 10: Firms use convertible debt to attract investors unsure about the riskiness of the firm (more relevant for smaller firms).
Graham-Harvey (2001): Theory-Practice of Corporate Finance • 5.3. Underinvestment problem • Table 6: Consistent with theory underinvestment more of a concern for growth firms compared to non-growth firms. • Table 6: Overall, underinvestment does not appear to be a major concern.
What Do We Know About Capital Structure Rajan-Zingales (1995) Factors Correlated with Leverage 1. Tangibility of Assets Tangible assets can serve as collateral, diminishing the risk of the lender. Assets would retain more value in case of liquidation.
Factors Correlated with Leverage 2. Investment Opportunities The Underinvestment Problem : With risky debt outstanding, shareholders may sometimes not undertake positive NPV projects. Company Value = Value of Tangible Assets in Place + Value of Future Growth Opportunities V = TA + G V/TA = 1 + G/TA Market/Book : Correlated with Growth Opportunities. Hence, high Market/Book companies (because they have more future growth opportunities) will issue less debt (be less levered).
Factors Correlated with Leverage 2. Investment Opportunities High Market/Book companies (because they have more future growth opportunities) will issue less debt (be less levered). Implying negative correlation between market/book and leverage. Rajan-Zingales (1995) Page 1456: “The negative correlation of market-to book with leverage seems to be driven mainly by large equity issuers.” Above evidence for companies in the US, Japan, UK, and Canada. “From a theoretical standpoint, the evidence is puzzling. If the market-to-book ratio proxies for the underinvestment costs associated with high leverage, then firms with high market-to-book ratios should have low debt, independent of whether they raise equity internally via retained earnings, or externally. “Firms attempt to time the market by issuing equity when their price (and hence, their market-to-book ratio) is perceived to be high.”
Factors Correlated with Leverage 3. Size Larger firms tend to be more diversified and fail less often, so size may be an inverse proxy for the probability of bankruptcy. Hence, larger firms may issue more debt. 4. Profitability More profitable companies use less debt. Firm’s cash flow identity: • New debt + New equity + Net income = • Interest payment + Dividend + New investment
Firms’ Histories and Their Capital Structures Kayhan-Titman (2004) Optimal Capital Structure: Tradeoffs between the costs and benefits of debt. At the optimum: Relation between capital structure and firm value may be weak, such that cost of deviating from the optimum is small. “When this is the case, capital structures are likely to be strongly influenced by transaction costs and market considerations that may temporarily affect the relative costs of debt versus equity financing, making the idea of a target debt ratio much less important.”
Debt-Value Function: V0 Value of Company V1 V2 D1 D0 D2 Debt/Total Capital
Debt-Value Function: • Small deviations from optimal capital structure, D0, may not have a big impact on firm value. V0 Value of Company D0 Debt/Total Capital
Table A2: Predicting Leverage • Leverage is positively related to • Property, plant, and equipment • Size. • Leverage is negatively related to • Market-to-book • Profitability • Selling expense • R&D. • Leverage Deficit = Actual Leverage – Predicted Leverage
Table 3: Leverage • Prior stock returns have a very significant impact on capital structure. • Prior stock returns might also lead to a change in target capital structure. • High stock returns might signal more growth opportunities suggesting lower debt ratios. • As firm performs better, managers may get entrenched. Managers prefer less debt (than optimal) because they personally incur bankruptcy costs and have less discretion in more levered firms.