Overview of Numerical Summaries and Simple Graphs in Probability and Statistics
130 likes | 247 Vues
This lecture presents key concepts in probability and statistics, focusing on numerical summaries and simple graphical representations. We explore sample measurements from different locations and their statistical properties, including mean, median, standard deviation, and interquartile range (IQR). Special attention is given to the works of John Wilder Tukey and the concept of outliers in data analysis, illustrated through boxplots. The lecture aims to deepen understanding of data distributions and the interpretation of statistical measures in practical scenarios.

Overview of Numerical Summaries and Simple Graphs in Probability and Statistics
E N D
Presentation Transcript
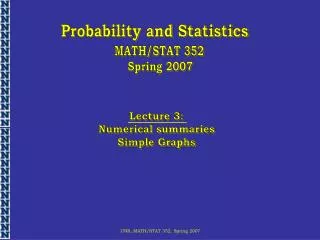
Probability and Statistics MATH/STAT 352 Spring 2007 Lecture 3: Numerical summaries Simple Graphs UNR, MATH/STAT 352, Spring 2007
Sample 1 Different locations! Measurement Sample 2 Measurement UNR, MATH/STAT 352, Spring 2007
Sample 1 Measurement Sample 2 Different spread! Measurement UNR, MATH/STAT 352, Spring 2007
Quantitative measures of location and spread UNR, MATH/STAT 352, Spring 2007
N=76, Sample mean = 6.66, Median = 7 Sample St. Dev. = 3.516, Q1=3, Q3=10 IQR=Q3-Q1=7 UNR, MATH/STAT 352, Spring 2007
N=76, Sample mean = 1.536, Median = 0.65 Sample St. Dev. = 5.892, Q1=0.01, Q3=0.95 IQR=Q3-Q1=0.94 UNR, MATH/STAT 352, Spring 2007
N=500, Sample mean = -0.02, Median = 0.03 Sample St. Dev. = 1.02, Q1=-0.64, Q3=0.67 IQR=Q3-Q1=1.31 UNR, MATH/STAT 352, Spring 2007
N=37, Sample mean = 91.62, Median = 92.0 Sample St. Dev. = 6.54, Q1=87.5, Q3=96.0 IQR=Q3-Q1=8.5 UNR, MATH/STAT 352, Spring 2007
John Wilder Tukey (June 16, 1915 - July 26, 2000) UNR, MATH/STAT 352, Spring 2007
Maximal data point within 1.5 IQR of Q3 3-rd quartile, Q3 median 1-st quartile, Q1 Mimimal data point within 1.5 IQR of Q1 Outliers Simple plots: boxplot UNR, MATH/STAT 352, Spring 2007
Simple plots: comparative boxplot UNR, MATH/STAT 352, Spring 2007
Simple plots: comparative boxplot UNR, MATH/STAT 352, Spring 2007