Download

1 / 18
180 likes | 273 Vues
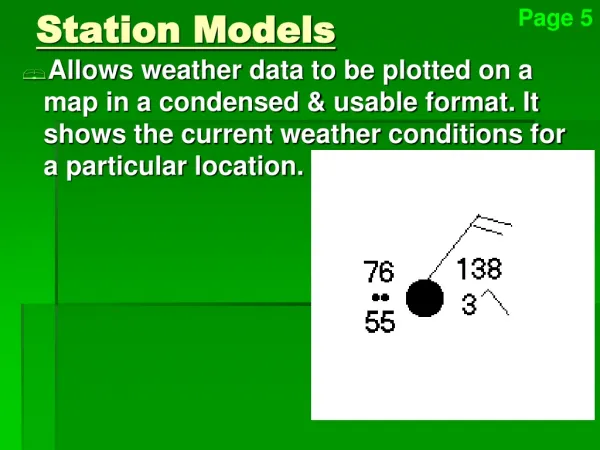
Learn how to read a weather station model displaying temperature, present weather types, visibility, dewpoint, wind speed, cloud cover, atmospheric pressure, barometric trend, and precipitation. Remember the key symbols and conversions. Practice plotting station information with pencil.

E N D
Temperature (degrees F) Top Left of Station Model
Bottom Left of Station Model Dewpoint Temperature in ˚F
Wind Symbols: Speed Calm Less than 5kts 5 kts 10 kts 50 kts
Remember your wind speed feathers… Does anyone see what is wrong with these images? The flags and feathers are on the wrong side of the staff.
Inside the center of the station model Cloud Cover in %
Barometric (Atmospheric) Pressure Upper right corner of station model
Remember how to convert pressure code • 196…………………………..1019.6mb • 423…………………………..1042.3mb • 895…………………………..989.5mb
Barometric Trend (continued) + :pressure rising / :pressure rising steadily - :pressure falling \ :pressure falling steadily
Precipitation in inches over the past 6 hours Bottom right of station model
Plotting Station Model Information • Please use PENCIL only!!!