Count data analysis in the small RNA sequencing
Count data analysis in the small RNA sequencing. Cai Tao NIBS. Count data in high-throughput sequencing. Reads counts is most straightforward information in the deep sequencing technology such as small RNA, methlytion and DGE etc. Count and relative frequency. Count and relative frequency.

Count data analysis in the small RNA sequencing
E N D
Presentation Transcript
Count data analysis in the small RNA sequencing Cai Tao NIBS
Count data in high-throughput sequencing Reads counts is most straightforward information in the deep sequencing technology such as small RNA, methlytion and DGE etc
Correspondence analysis • Describing and interpreting data • Relative frequencies • Chi-square distance • Weighted for the mass • Distance for Clustering
Entropy and Mutual information • Entropy • H= -Sum( Pi *log(Pi)) • Mutual information • I(x,y) = H(x) + H(y) – H(x,y)
Statistical comparison • Goodness of fitness (chisq.test) • Fisher exact test • fisher.test • Likelihood ratio test • 1-pchisq(log(likelihood) , df)
Statistical comparison Expected of Y is the variance of Y is Expected of Y is the variance of Y is
Questions raised based NB distribution • How to properly estimate the variance of counts? • using local regression • How to statistically compare the counts data A and B? • The p-value of a pair of observed count sums (A; B) is then the sum of all probabilities less or equal to p(A; B), given that the overall sum is A+B • DESeq package for the calculation
Regression • Poisson regression • log(Y) ~ covariate + treatment + log(offset) • LRT test • Negative binomial regression • glmFit in edgeR package • LRT test
The modern RNA world Costa FF, Gene 357, 83
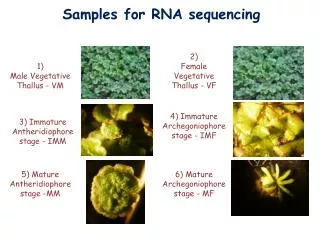
Arabidopsis endogenous small RNAs “TRENDS in Plant Science” Vol.11 No.9
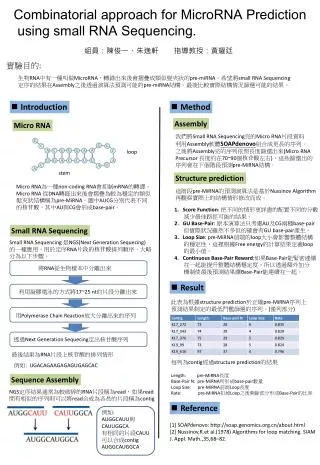
miRNA definition in Plant • Precise excision from the stem of a stem-loop precursor • miRNA/miRNA* structure • Good match with certain limited mismatch • Deep sequencing will be great helpful Plant Cell. 2008, 20(12):3186-90
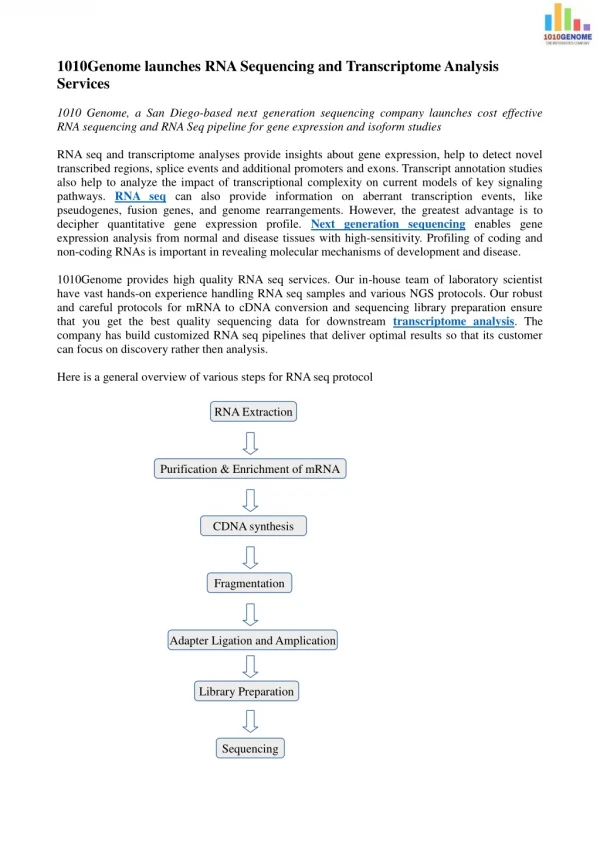
miRNA analysis pipeline • Removing the adapters • Produce unique tag • Mapping to miRBase hairpin and do some revision of miRbase sequencing • Count miRNAs • Visualization • Comparison
Pre-installed software • Emboss • Vienna RNA Package • Bowtie • R package (entropy, ca) • Bioconductor package (EdgeR, baySeq, DESeq)
Data pre-procession • Find the fastq file, and converted to fasta file • perl fastq2fasta.pl 01.txt > 01.raw.fasta • Using vectorstrip from EMBOSS package to remove the adapter • vectorstrip -sequence 01.raw.fasta Yes -vectorsfile vector -mismatch 20 -besthits -outfile 01.vectorstrip -outseq 01.fasta • Collapse the file to unique small RNA • perl sRNA.pl 01.fasta > 01.sRNA • perl checkuniqseq.pl 01.sRNA > 01.sRNA.uniq
Mapping • Bowtie mapped to the whole genome and extract the perfect matched small RNA • bowtie a_thaliana -f 01.sRNA.uniq 01.uniq.map -a -v 0 -p 4 --al 01.uniq.match --un 01.uniq.unmatch • Bowtie mapped to the miRbase hairpins • bowtie miRbase -f 01.uniq.match 01.uniq.miRbase.map -a -v 0 -p 4 --al 01.uniq.miRbase.match --un 01.uniq.miRbase.unmatch • Check the mapping in the miRbase hairpins (Vienna RNA Package needed) • perl check_hairpin.pl miRbase.fna2 01.uniq.miRbase.map miRbase.pos
Count the miRNA • Provide the revised miRNA table with position • miRbase_revised.pos • Count for each of the miRNAs • perl count_miRNA.pl miRbase_revised.pos 01.uniq.miRbase.map • Provide the RPM counts • Count*106/library size
Visualization • Find the miRNA counts tables here • CA_demo.xlsx • Visualization demo (workshop.R) • Analysis the tissue specific miRNAs • Do the CA analysis • Do the clusters
Statistical comparison • Comparing the samples from embryos and leavesusing edgeR, DESeq, BaySeq, regression (workshop2.R)