Download

1 / 18
180 likes | 368 Vues
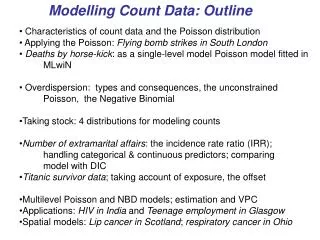
Analysis of count data. With the kind help or data provided by Gregory Territo and Shaila Morales . Abundance changes with salinity in the Mangrove Salt Marsh Snake, N. clarkii. > model1 <- glm ( d_c ~ sal * sp , family = poisson )

E N D
Analysis of count data With the kind help or data provided by Gregory Territo and Shaila Morales
Abundance changes with salinity in the Mangrove Salt Marsh Snake, N. clarkii
> model1 <- glm(d_c ~ sal*sp, family = poisson) Warning message: In model.matrix.default(mt, mf, contrasts) : variable 'sp' converted to a factor > summary(model1) Call: glm(formula = d_c ~ sal * sp, family = poisson) Deviance Residuals: Min 1Q Median 3Q Max -2.4345 -1.2173 -1.0171 0.6468 3.9516 Coefficients: Estimate Std. Error z value Pr(>|z|) (Intercept) 2.853143 0.237389 12.019 < 2e-16 *** sal -0.037690 0.008917 -4.227 2.37e-05 *** spf 0.608123 0.289701 2.099 0.0358 * spq -1.783507 0.339976 -5.246 1.55e-07 *** sal:spf -0.178313 0.027435 -6.500 8.05e-11 *** sal:spq 0.032300 0.013745 2.350 0.0188 * --- Signif. codes: 0 ‘***’ 0.001 ‘**’ 0.01 ‘*’ 0.05 ‘.’ 0.1 ‘ ’ 1 (Dispersion parameter for poisson family taken to be 1) Null deviance: 238.78 on 38 degrees of freedom Residual deviance: 107.18 on 33 degrees of freedom AIC: 227.64 Number of Fisher Scoring iterations: 5
> model2 <- glm(d_c ~ sal*sp, family = quasipoisson) Warning message:Inmodel.matrix.default(mt, mf, contrasts) : variable 'sp' converted to a factor > summary(model2) Call: glm(formula = d_c ~ sal * sp, family = quasipoisson) Deviance Residuals: Min 1Q Median 3Q Max -2.4345 -1.2173 -1.0171 0.6468 3.9516 Coefficients: Estimate Std. Error t value Pr(>|t|) (Intercept) 2.85314 0.47305 6.031 8.8e-07 *** sal -0.03769 0.01777 -2.121 0.04150 * spf 0.60812 0.57730 1.053 0.29981 spq -1.78351 0.67748 -2.633 0.01279 * sal:spf -0.17831 0.05467 -3.262 0.00258 ** sal:spq 0.03230 0.02739 1.179 0.24671 --- Signif. codes: 0 ‘***’ 0.001 ‘**’ 0.01 ‘*’ 0.05 ‘.’ 0.1 ‘ ’ 1 (Dispersion parameter for quasipoisson family taken to be 3.971014) Null deviance: 238.78 on 38 degrees of freedom Residual deviance: 107.18 on 33 degrees of freedom AIC: NA Number of Fisher Scoring iterations: 5
> summary(model3) Call: glm(formula = d_c ~ sal + sp, family = quasipoisson) Deviance Residuals: Min 1Q Median 3Q Max -2.9486 -1.7524 -0.6882 0.6169 6.1301 Coefficients: Estimate Std. Error t value Pr(>|t|) (Intercept) 2.88005 0.50451 5.709 1.87e-06 *** sal -0.03894 0.01706 -2.283 0.0286 * spf -0.57515 0.50947 -1.129 0.2666 spq -1.25011 0.50293 -2.486 0.0179 * --- Signif. codes: 0 ‘***’ 0.001 ‘**’ 0.01 ‘*’ 0.05 ‘.’ 0.1 ‘ ’ 1 (Dispersion parameter for quasipoisson family taken to be 6.417679) Null deviance: 238.78 on 38 degrees of freedom Residual deviance: 168.81 on 35 degrees of freedom AIC: NA Number of Fisher Scoring iterations: 5
### Fitting the model # Write model Ancova<-function() ## Priors { c ~ dlnorm(0,1.0E-6) for (i in 1:3) { a[i] ~ dlnorm(0,1.0E-6) } ## Likelihood for (i in 1:n) { mean[i] <- a[z[i]] + c*x[i] Y[i] ~ dpois(mean[i]) } } write.model(Ancova,"Ancova.txt")
results Iterations = 1001:10000 Thinning interval = 1 Number of chains = 3 Sample size per chain = 9000 1. Empirical mean and standard deviation for each variable, plus standard error of the mean: Mean SD Naive SE Time-series SE a[1] 2.645e+00 0.381013 2.319e-03 2.173e-02 a[2] 6.609e+00 0.908557 5.529e-03 5.702e-03 a[3] 6.984e+00 0.829348 5.047e-03 5.047e-03 c 5.648e-04 0.001934 1.177e-05 2.569e-05 deviance 3.122e+02 2.571152 1.565e-02 7.128e-02 2. Quantiles for each variable: 2.5% 25% 50% 75% 97.5% a[1] 1.902e+00 2.398e+00 2.617e+00 2.914e+00 3.400e+00 a[2] 4.956e+00 5.978e+00 6.565e+00 7.197e+00 8.521e+00 a[3] 5.457e+00 6.404e+00 6.946e+00 7.523e+00 8.710e+00 c 1.178e-09 1.358e-07 4.501e-06 1.472e-04 5.876e-03 deviance 3.092e+02 3.103e+02 3.116e+02 3.136e+02 3.187e+02
Visitation rate? Hanlon, et al. 2014. Pollinator deception in the Orchid Mantis. American Naturalist 183
8.12 6.06 0.45
> model1 <- glm(total ~ type, family = poisson) > summary(model1) Call: glm(formula = total ~ type, family = poisson) Deviance Residuals: Min 1Q Median 3Q Max -4.0302 -0.9535 -0.8928 0.6971 6.4671 Coefficients: Estimate Std. Error z value Pr(>|z|) (Intercept) 1.80181 0.07071 25.481 < 2e-16 *** typeTotal_Mantid0.2927 0.09344 3.132 0.00174 ** typezTotal_Control -2.5903 0.26771 -9.676 < 2e-16 *** --- Signif. codes: 0 ‘***’ 0.001 ‘**’ 0.01 ‘*’ 0.05 ‘.’ 0.1 ‘ ’ 1 (Dispersion parameter for poisson family taken to be 1) Null deviance: 585.14 on 98 degrees of freedom Residual deviance: 296.44 on 96 degrees of freedom AIC: 554.08 Number of Fisher Scoring iterations: 6
> model2 <- glm(total ~ type, family = quasipoisson) > summary(model2) Call: glm(formula = total ~ type, family = quasipoisson) Deviance Residuals: Min 1Q Median 3Q Max -4.0302 -0.9535 -0.8928 0.6971 6.4671 Coefficients: Estimate Std. Error t value Pr(>|t|) (Intercept) 1.8018 0.1353 13.312 < 2e-16 *** typeTotal_Mantid 0.2927 0.1789 1.636 0.105 typezTotal_Control -2.5903 0.5124 -5.055 2.06e-06 *** --- Signif. codes: 0 ‘***’ 0.001 ‘**’ 0.01 ‘*’ 0.05 ‘.’ 0.1 ‘ ’ 1 (Dispersion parameter for quasipoisson family taken to be 3.663778) Null deviance: 585.14 on 98 degrees of freedom Residual deviance: 296.44 on 96 degrees of freedom AIC: NA Number of Fisher Scoring iterations: 6
### Fitting the model # Write model Anovam<- function() ## Priors { for (i in 1:3) { c[i] ~ dlnorm(0.0,1.0E-6) } ## Likelihood for (i in 1:n) { mean[i] <- c[x[i]] Y[i] ~ dpois(mean[i]) } } write.model(Anovam,"Anovam.txt")
> results<-summary(reg.coda) > results Iterations = 501:5000 Thinning interval = 1 Number of chains = 3 Sample size per chain = 4500 1. Empirical mean and standard deviation for each variable, plus standard error of the mean: Mean SD Naive SE Time-series SE c[1] 6.0630 0.4285 0.003688 0.0036881 c[2] 8.1220 0.4968 0.004275 0.0043329 c[3] 0.4546 0.1169 0.001006 0.0009949 deviance 551.0826 2.4689 0.021249 0.0214720 2. Quantiles for each variable: 2.5% 25% 50% 75% 97.5% c[1] 5.2550 5.7680 6.0520 6.3510 6.9200 c[2] 7.1800 7.7830 8.1120 8.4480 9.1285 c[3] 0.2533 0.3717 0.4446 0.5265 0.7113 deviance 548.3000 549.3000 550.4000 552.2000 557.4000