Fundamentals of Signal Sampling and Rate Conversion
Learn about sampling, Fourier transform, spectrum, reconstruction, downsampling, upsampling, filtering, ADC, DAC, and practice examples in signal processing.

Fundamentals of Signal Sampling and Rate Conversion
E N D
Presentation Transcript
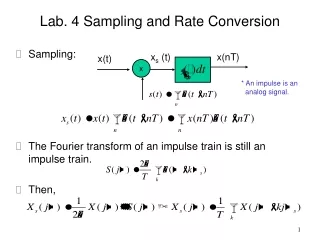
Lab. 4 Sampling and Rate Conversion • Sampling: • The Fourier transform of an impulse train is still an impulse train. • Then, xs (t) x(nT) x(t) x * An impulse is an analog signal.
Spectrum: • Reconstruction: Sampling xs (t) x(nT) x(nT) Ideal LPF x
Practical sampling device (ADC): * FLASH ADC
Successive approximation ADC: * Tree search
Downsampling: • Let m=i+kM and we have Xd(n)= x(Mn) x(n)
Spectrum: • To avoid aliasing, a filter is generally applied before the downsampling operation. • Upsampling: i=1 i=1 i=0 i=0 i=0 Xd(n)= x(Mn) x(n) LPF Cutoff=/M Gain=1 Xu(n)= x(n/L) x(n)
The spectrum: Ideal LPF
The upsampling process is then equivalent to increase the sampling rate by a factor of L. • The filtering operation is also known as interpolation. Gain=L Xu(n) x(n) LPF Cutoff=/L
Practice 1: • Generate a sinusoidal signal, downsample the signal, and observe the its spectrum. • Determine the maximum downsampling rate such that the aliasing will not occur. • Then upsample the downsampled signal, and observe its spectrum.
General filter design: • Pass band • Stop band • Transition band • Passband ripple/stopband ripple A lowpass filter
The analog filter design (IIR): • 1. Butterworth, 2. Chebychev I, 3. Chebychev II, 4. Ellipic
Practice 2: • Generate a sinusoidal signal, downsample the signal (no aliasing), and then upsample the downsampled signal. • Design an FIR LPF and let the upsampled signal pass the filter such that the upsampled signal is similar to the original signal. • Calculate the MSE of these two interpolation schemes.
Practice 3: • Create an random digital signal and upsampled it with a selected factor. • Observe the spectrum of the upsampled signal. • Reading assigment: • Pulse shaping (CS: 4.5) • RC, SRRC
Filter design(FDA tool) • Key “fdatool” in the console of MATLAB • Adjust parameters for your requirement • Press “Filter coefficients” to get filter time-domain response h[n] • Convolve h[n] in your C program to implement lowpass filtering • Plot spectrum in MATLAB • Plot( abs( fft( x ) ) ) • fft(): Fast Fourier Transform, frequency interval is [0 fs] • abs(): get magnitude