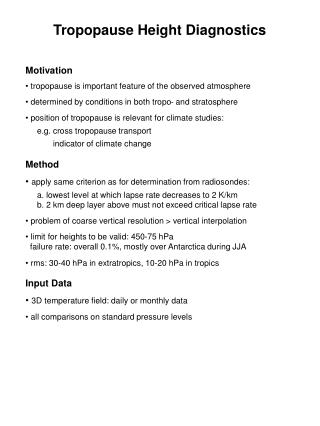
IPV and the Dynamic Tropopause
760 likes | 1.21k Vues
IPV and the Dynamic Tropopause. John W. Nielsen-Gammon Texas A&M University 979-862-2248 n-g@tamu.edu. Outline. PV basics Seeing the world through PV Waves and vortices Nonconservation Forecasting applications Short-range forecasting Tracking disturbances over the Rockies

IPV and the Dynamic Tropopause
E N D
Presentation Transcript
IPV and the Dynamic Tropopause John W. Nielsen-Gammon Texas A&M University 979-862-2248 n-g@tamu.edu
Outline • PV basics • Seeing the world through PV • Waves and vortices • Nonconservation • Forecasting applications • Short-range forecasting • Tracking disturbances over the Rockies • Understanding the range of possibilities IPV and the Dynamic Tropopause John W. Nielsen-Gammon
Mathematical Definitions of PV • Rossby: Vorticity divided by theta surface spacing : Relative vorticity in isentropic coordinates Minus sign: makes PV positive since pressure decreases upward IPV and the Dynamic Tropopause John W. Nielsen-Gammon
Mathematical Definitions of PV • Rossby: • Ertel: Vorticity times static stability IPV and the Dynamic Tropopause John W. Nielsen-Gammon
Units of Potential Vorticity • 1 PVU equals…you don’t want to know • Midlatitude Troposphere: -0.2 to 3.0 PVU • Typical value: 0.6 PVU • Midlatitude Stratosphere: 1.5 to 10.0 PVU • Typical value: 5.0 PVU IPV and the Dynamic Tropopause John W. Nielsen-Gammon
PV Cross Section Pole to Pole at 80W IPV and the Dynamic Tropopause John W. Nielsen-Gammon
PV and Westerlies (m/s) IPV and the Dynamic Tropopause John W. Nielsen-Gammon
PV and Absolute Vorticity (*10-5 s-1) IPV and the Dynamic Tropopause John W. Nielsen-Gammon
PV and Potential Temperature (K) 380 350 330 280 310 IPV and the Dynamic Tropopause John W. Nielsen-Gammon
Steep PV gradients Jet streams High PV to left of jet Vorticity gradients Same sign as PV gradients Stratification gradients High stratification where PV is large Vertical tropopause Flat PV gradients Boring No wind or vorticity variations Stratification high where PV is large Flat tropopause What do PV gradients imply? IPV and the Dynamic Tropopause John W. Nielsen-Gammon
PV Contours: 0, 0.25, 0.5, 1, 2, 4, 8 IPV and the Dynamic Tropopause John W. Nielsen-Gammon
IPV and the Dynamic Tropopause John W. Nielsen-Gammon
IPV and the Dynamic Tropopause John W. Nielsen-Gammon
PV Contours: 0, 0.25, 0.5, 1, 2, 4, 8 IPV and the Dynamic Tropopause John W. Nielsen-Gammon
IPV and the Dynamic Tropopause John W. Nielsen-Gammon
IPV and the Dynamic Tropopause John W. Nielsen-Gammon
Jet stream follows PV gradients Waves in the PV field correspond to waves in the jet stream PV extrema bounded by strong gradients could mean short waves or cutoffs High PV = trough; Low PV = ridge Strong PV gradients matter; PV maxes and mins are inconsequential IPV and the Dynamic Tropopause John W. Nielsen-Gammon
Advantages of Height Identification and assessment of features Inference of wind and vorticity Inference of vertical motion? Disadvantages of Height Gravity waves and topography Inference of evolution and intensification Role of diabatic processes is obscure Need 300 & 500 mb Forget PV! The Traditional Geopotential Height Maps Work Fine! IPV and the Dynamic Tropopause John W. Nielsen-Gammon
Advantages of PV PV is conserved PV unaffected by gravity waves and topography PV at one level gives you heights at many levels Easy to diagnose Dynamics Disadvantages of PV Unfamiliar Not as easily available Not easy to eyeball significant features Qualitative inference of wind and vorticity Hard to diagnose vertical motion? What’s PV Got that Traditional Maps Haven’t Got? IPV and the Dynamic Tropopause John W. Nielsen-Gammon
DYNAMICS? • A given PV distribution implies a given wind and height distribution • If the PV changes, the winds and heights change • If you know how the PV is changing, you can infer everything else • And PV changes only by advection! IPV and the Dynamic Tropopause John W. Nielsen-Gammon
The PV Conundrum • Maps of mean PV between pressure surfaces • Encapsulates the PV distribution • Cannot diagnose evolution or dynamics IPV and the Dynamic Tropopause John W. Nielsen-Gammon
The PV Conundrum • IPV (Isentropic Potential Vorticity) maps • Many isentropic surfaces have dynamically significant PV gradients • Hard to know which isentropic surfaces to look at IPV and the Dynamic Tropopause John W. Nielsen-Gammon
The PV Solution: Tropopause Maps • Pick a PV contour that lies within the (critical) tropopause PV gradient • Overlay this particular contour from all the different isentropic layers (or interpolate to that PV value) • Result: one map showing the location of the important PV gradients at all levels • Contours advected by horizontal wind IPV and the Dynamic Tropopause John W. Nielsen-Gammon
The 1.5 PVU contour on the 320 K isentropic surface is… IPV and the Dynamic Tropopause John W. Nielsen-Gammon
…identical to the 320 K contour on the 1.5 PVU (tropopause) surface! IPV and the Dynamic Tropopause John W. Nielsen-Gammon
Color Fill Version of Tropopause Map IPV and the Dynamic Tropopause John W. Nielsen-Gammon
Tropopause Map with Jet Streams IPV and the Dynamic Tropopause John W. Nielsen-Gammon
Tropopause Map, hour 00 IPV and the Dynamic Tropopause John W. Nielsen-Gammon
Tropopause Map, hour 06 IPV and the Dynamic Tropopause John W. Nielsen-Gammon
Tropopause Map, hour 12 IPV and the Dynamic Tropopause John W. Nielsen-Gammon
Tropopause Map, hour 18 IPV and the Dynamic Tropopause John W. Nielsen-Gammon
Tropopause Map, hour 24 IPV and the Dynamic Tropopause John W. Nielsen-Gammon
Tropopause Map, hour 30 IPV and the Dynamic Tropopause John W. Nielsen-Gammon
Tropopause Map, hour 36 IPV and the Dynamic Tropopause John W. Nielsen-Gammon
Tropopause Map, hour 42 IPV and the Dynamic Tropopause John W. Nielsen-Gammon
Tropopause Map, hour 48 IPV and the Dynamic Tropopause John W. Nielsen-Gammon
Tropopause Map, hour 48, with jets IPV and the Dynamic Tropopause John W. Nielsen-Gammon
Midway Point • Play with some PV • Watch a movie IPV and the Dynamic Tropopause John W. Nielsen-Gammon
PV Dynamics: The Short Course High PV / Stratosphere / Low Theta on Tropopause Low PV / Troposphere / High Theta on Tropopause IPV and the Dynamic Tropopause John W. Nielsen-Gammon
Superposition • PV field • Basic state • Anomalies • Associated wind field • Basic state wind • Winds associated with each anomaly • Add ‘em all up to get the total wind/PV IPV and the Dynamic Tropopause John W. Nielsen-Gammon
PV Anomaly: A Wave on the Tropopause + IPV and the Dynamic Tropopause John W. Nielsen-Gammon
PV Anomaly: Anomalous Winds Think of each PV anomaly as a cyclonic or anticyclonic vortex + IPV and the Dynamic Tropopause John W. Nielsen-Gammon
PV Wind Rules (for Northern Hemisphere) • Positive anomalies have cyclonic winds • Negative anomalies have anticyclonic winds • Winds strongest near anomaly • Winds decrease with horizontal distance • Winds decrease with vertical distance IPV and the Dynamic Tropopause John W. Nielsen-Gammon
PV Anomaly: What will the total wind field be? Short Wave + Planetary Wave + IPV and the Dynamic Tropopause John W. Nielsen-Gammon
Wave Propagation • Individual waves propagate upstream • Short waves move slower than jet • Long waves actually retrogress + + IPV and the Dynamic Tropopause John W. Nielsen-Gammon
The Making of a Rossby Wave Packet • Trough amplifies downstream ridge • Ridge amplifies downstream trough, weakens upstream trough • Wave packet propagates downstream - - + + + + IPV and the Dynamic Tropopause John W. Nielsen-Gammon
Intensification: Two Ways • Increase the size of the PV anomaly • “Amplification” • Increase the amount of PV (or number of PV anomalies) within a small area • “Superposition” IPV and the Dynamic Tropopause John W. Nielsen-Gammon
Tropopause, Feb. 10, 2001, 00Z Amplification Superposition? IPV and the Dynamic Tropopause John W. Nielsen-Gammon
Tropopause, Feb. 10, 2001, 06Z IPV and the Dynamic Tropopause John W. Nielsen-Gammon
Tropopause, Feb. 10, 2001, 12Z IPV and the Dynamic Tropopause John W. Nielsen-Gammon