Download
1 / 34
340 likes | 360 Vues
This study investigates the historical dynamics of woody plant invasion in the Southern Meshomasic region using historical photographs, aerial mosaics, and satellite imagery. It analyzes land-use changes over five different time periods and examines the impact of these changes on the presence and abundance of target invasive plant species. Regression modeling is used to explore the relationship between environmental factors, land-use categories, and invasive plant abundance.

E N D
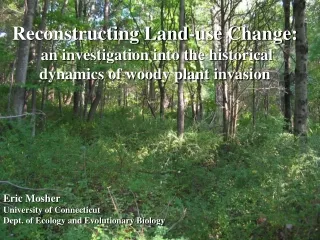
Reconstructing Land-use Change: an investigation into the historical dynamics of woody plant invasion Eric Mosher University of Connecticut Dept. of Ecology and Evolutionary Biology
Southern Meshomasic Region Study area is approximately 88 square kilometers
Research Steps Process historical photographs - create geo-corrected mosaic images for 5 different time periods: 1934, 1951, 1970, 1991, 2003 Digitize land use features for each time step- visual interpretation of aerial mosaics using 6 LULC categories Identify and Locate LULC change categories Create a stratified random sampling scheme - based upon LULC change categories Data Collection - based upon the IPANE plot protocols
1991 DOQQ Mosaic Baseline Image: all other images geo-corrected to this one.
Digitizing Landuse / Landcover Types Forests Cultivated Fields Pasture/Meadow Residential/Commercial Abandoned Fields Waterbodies
1951 Digitized Mosaic Total # of Polygons = 2621
LULC Change Categories 1. Forest - No Change 2. Cultivated Fields - No change 3. Pasture/Meadow - No change 4. Residential/Commercial - No change 5. Abandoned fields to Forest 6. Cultivated fields to Forest 7. Pasture/Meadow to Forest 8. Cultivated Fields to Abandoned to Forest 9. Pasture/Meadow to Abandoned to Forest 10. Cultivated fields to Abandoned fields 11. Pasture/Meadow to Abandoned fields 12. Forest to Residential/Commercial 13. Cultivated fields to Residential/Commercial 14. Pasture to Residential/Commercial 15. Abandoned fields to Residential/Commercial 16. Abandoned fields to Forest to Residential/Commercial No Change Agricultural Fields Reverted to Forest Abandoned Fields as of 2003 Developed to Residential/ Commercial
All 4 No Change Categories 5575 Hectares
Agricultural Fields to Forest 741 Hectares
Developed to Residential/Commercial 940 Hectares
Random Points 17 Categories: 50 pts. Per category
6 Target Species Berberis thunbergii Celastrus orbiculatus Elaeagnus umbellata Euonymus alata Lonicera morrowii (some x bella ?) Rosa multiflora
Plot Data Dictionary Based on the IPANE Plot Protocol - loaded into a Trimble GeoExplorer 3 GPS unit - For Each Plot (Circular -10 meter diameter): Habitat: one of 33 different types Near Trail? :Yes or No Percent Canopy Cover: 4 categories Aspect: eight directions, plus flat Soil Moisture: xeric, mesic, saturated, inundated Other Invasives Species Present Associated Species and Site Notes
For Each Target Species: Presence / Absence Abundance: 6 categories Distribution within Plot: 6 categories Percent Cover within Plot: 7 categories
Final Plot Points 603 in Total: 507 Random, 96 Opportunistic
Presence of One or More Target Species All Plots: 363 / 603 or 60.2% Random Plots: 288 / 507 or 55.4%
%Presence/Absence Individual Species by LULC Groups (From Random Plots: N = 507)
Hierarchy of Invasion ( Abundance of all species combined) (Compared using the Wilcoxon Rank SumTest) 1st: Abandoned Fields as of 2003 (p = .005) 2nd: Agricultural Fields Reverted to Forest (p < .0001) 3rd: Developed to Residential / Commercial (p < .0001) 4th: No Change Categories
The 43 Worst Plots: % Invasive Cover 38 out of 43 (88%) Abandoned Fields or Fields Reverted to Forest 3 out of 43 Residential/Commercial 2 out of 43 Forest No Change
Regression Modeling GLMs and GAMs (using SPLUS 6.1) Explanatory Variables: Plot Environmental Factors Canopy closure (4) Habitat type (24) Grouped Habitat types (4) Managed, “unnatural” plot? (yes, no) Soil Moisture (4) Aspect (9) Along Trail? (yes,no) LULC Factors LULC Change Categories (16) Grouped LULC Change Categories (4) Individual Time Step LULC classes (5 per step) GIS / Satellite Factors Elevation (DEM) Slope Soil Drainage Characteristics (4) Soil Types (27) NDVI, August 1999 Anthropogenic Proxy Factors Distance to Nearest Road (year 2000 only) Distance to Nearest House (for each time step) Road Density (for 4 different buffer diameters) Distance to “Edge” Building Density (for each time step, 4 buffer diameters)
All Target Species: Abundance R squared Grouped GLM Canopy Closure (4) .183 Grouped LULC Change(4) .318 log (Distance to Edge) .375 Managed Plots .404 Separate Factors GLM log (Distance to Edge) .149 0 to 25% Canopy Closure .267 Forests - No Change .334 Managed Plots .366 Cultivated Fields - No Change .393
Berberis thunbergii: Abundance Grouped GLM R squared Canopy Closure (4) .191 Grouped LULC (4) .246 1951 Cover type (5) .284 log (Distance to Edge) .313 Separate Factors GLM 0 to 25% Canopy Closure .171 Fields reverted to Forest .216 log (Distance to Edge) .233 Yard .246 NDVI .257
Celastrus orbiculatus : Abundance Grouped GLM R squared Canopy Closure (4) .139 Grouped LULC (4) .235 log (Distance to Edge) .268 1970 Cover type ( 5) .302 Managed Plots .322 Separate Factors GLM log (Distance to Edge) .127 Forest - No Change .175 0 to 25% Canopy Closure .238 Managed Plots .258 Cultivated Fields - No Change .277 51 to 75% Canopy Closure .289
Conclusions Stable forest blocks have a very low incidence of woody plant invasion Abandoned fields and post-agricultural forests harbor the greatest abundance of woody plant invaders Canopy closure, LULC change and distance to edge are the most consistent predictors of woody invasive abundance Distance to an edge is a relatively strong predictor of woody plant invasion, while other proxies for anthropogenic presence and disturbance are not.
Acknowledgments My thanks to the following people and institutions for their support: John Silander Dan Civco Andrew Latimer The Invasive Plant Atlas of New England The Connecticut Space Grant College Consortium