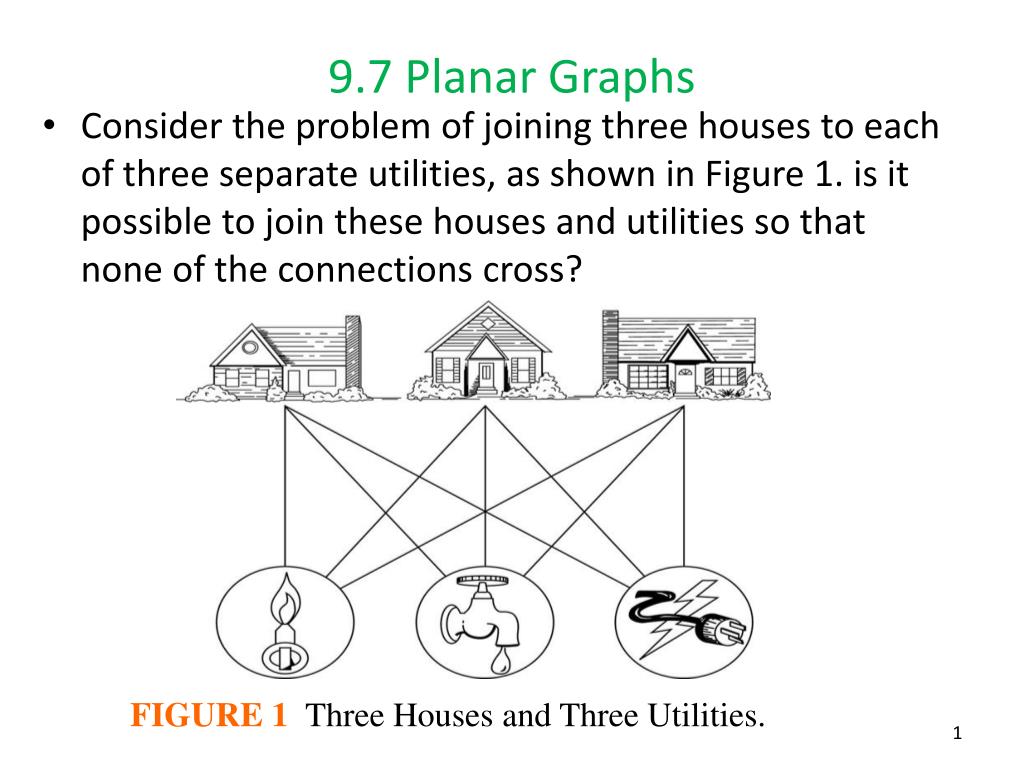
9.7 Planar Graphs • Consider the problem of joining three houses to each of three separate utilities, as shown in Figure 1. is it possible to join these houses and utilities so that none of the connections cross? FIGURE 1 Three Houses and Three Utilities.
Planar Graphs • Definition 1: A graph is called planar if it can be drawn in the plane without any edges crossing (where a crossing of edges is the intersection of the lines or arcs representing them at a point other than their common endpoint). • Such a drawing is called a planar representation of the graph.
Planar Graphs • Example 1: Is K4 (shown in below with two edges crossing) planar? FIGURE 2 The Graph K4. FIGURE 3 K4 Drawn with No Crossings.
Planar Graphs • Example 2: Is Q3 , shown in below ,planar? FIGURE 4 The Graph Q3. FIGURE 5 A Planar Representation of Q3.
Planar Graphs • Example 3: Is K3,3 , shown in below , planar? FIGURE 6 The Graph K3,3. FIGURE 7 Showing that K3,3 Is Nonplanar.
Euler’s Formula • A planar representation of a graph splits the plane into regions, including an unbounded region. For instance, the planar representation of the graph shown in below splits the plane into six regions. FIGURE 8 The Regions of the Planar Representation of a Graph.
Euler’s Formula • Theorem 1: Euler’s Formula • Let G be a connected planar simple graph with e edges and v vertices. Let r be the number of regions in a planar representation of G. Then r = e – v +2. FIGURE 9 The Basis Case of the Proof of Euler’s Formula. FIGURE 10 Adding an Edge to Gn to Produce Gn+1.
Euler’s Formula • Example 4: Suppose that a connected planar simple graph has 20 vertices, each of degree 3 . Into how many regions does a representation of this planar graph split the plane?
Euler’s Formula • Corollary 1: If G is a connected planar simple graph with e edges and v vertices, where v 3, then e 3v-6. • Example 5: Show that K5 is nonplanar using Corollary 1.
Euler’s Formula • Corollary 2: If G is a connected planar simple graph , then G has a vertex of degree not exceeding five. • Corollary 3: If a connected planar simple graph has e edges and v vertices with v 3 and no circuits of length three, then e 2v-4. • Example 6: Use Corollary 3 to show that K3,3 is nonplanar.
Kuratowski’s Theorem • If a graph is planar, so will be any graph obtained by removing an edge {u , v} and adding a new vertex w together with edges {u, w} and {w ,v} . Such an operation is called an elementary subdivision. • The graphs G1=(V1, E1) and G2=(V2, E2) are called homeomorphicif they can be obtained from the same graph by a sequence of elementary subdivisions.
Kuratowski’s Theorem • Example 7: Show that the graphs G1, G2, and G3 displayed in below are all homeomorphic. FIGURE 12 Homeomorphic Graphs.
Kuratowski’s Theorem • Theorem 2: A graph is nonplanar if and only if it contains a subgraphhomeomorphic to K3,3 or K5 . • Example 8: Determine whether the graph G shown in below is planar. FIGURE 13 The Undirected Graph G, a SubgraphHHomeomorphic to K5, and K5.
Kuratowski’s Theorem • Example 9: Is the Petersen graph , shown in below , planar? FIGURE 14 (a) The Petersen Graph, (b) a SubgraphHHomeomorphic to K3,3, and (c) K3,3.