Download
1 / 20
240 likes | 436 Vues
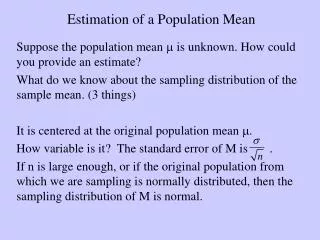
ESTIMATION OF THE MEAN. INTRO :: ESTIMATION. Definition The assignment of plausible value(s) to a population parameter based on a value of a sample statistic is called estimation. INTRO :: ESTIMATION. The sample statistic used to estimate a population parameter is called estimator .

E N D
INTRO :: ESTIMATION • Definition • The assignment of plausible value(s) to a population parameter based on a value of a sample statistic is called estimation.
INTRO :: ESTIMATION • The sample statistic used to estimate a population parameter is called estimator. • Examples … • sample mean estimator population mean • …
INTRO :: ESTIMATION The estimation procedure involves … • Select a sample. • Collect the required information from the members of the sample. • Calculate the value of the sample statistic. • Assign plausible value(s) to the corresponding population parameter.
POINT ESTIMATES & INTERVAL ESTIMATES • A Point Estimate • An Interval Estimate
A Point Estimate • Definition • The value of a sample statistic that is used to estimate a population parameter is called a point estimate.
INTERVAL ESTIMATES • Usually, whenever we use point estimation, we calculate the margin of error associated with that point estimation. Point Estimate w/out M.E. not very useful!!!!
Interval Estimates • Definition • In interval estimation, an interval is constructed around the point estimate, and it is stated that this interval is likely to contain the corresponding population parameter. Gives a range of plausible values for the parameter of interest.
Interval estimation. $1130 $1610
Interval Estimates • Definition • Each interval is constructed with regard to a given confidence level and is called a confidence interval. The confidence level associated with a confidence interval states how much confidence we have that this interval contains the true population parameter. The confidence level is denoted by (1 – α)100%.
INTERVAL ESTIMATION OF A POPULATION MEAN: • The t Distribution • Confidence Interval for μUsing the t Distribution
The t Distribution • Conditions Under Which the t Distribution Is Used to Make a Confidence Interval About μ • The t distribution is used to make a confidence interval about μ if • The population from which the sample is drawn is (approximately) normally distributed. • The population standard deviation, σ, unknown.
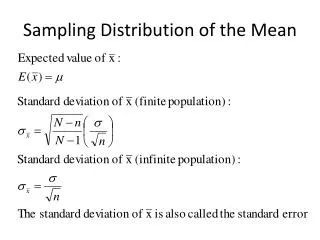
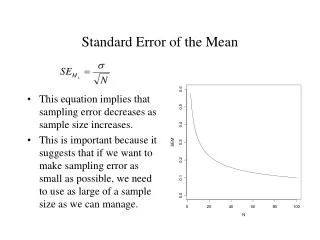
The t Distribution cont. • The t distribution is a specific type of bell-shaped distribution with a lower height and a wider spread than the standard normal distribution. As the sample size becomes larger, the t distribution approaches the standard normal distribution. The t distribution has only one parameter, called the degrees of freedom (df). The mean of the t distribution is equal to 0 and its standard deviation is .
The t distribution for df = 9 and the standard normal distribution. The standard deviation of the t distribution is The standard deviation of the standard normal distribution is 1.0 μ= 0
Example • Find the value of t for 16 degrees of freedom and .05 area in the right tail of a t distribution curve.
Determining t for 16 df and .05 Area in the Right Tail Area in the right tail df The required value of t for 16 df and .05 area in the right tail
The value of t for 16 df and .05 area in the right tail. .05 df = 16 0 1.746 t This is the required value of t
The value of t for 16 df and .05 area in the left tail. df = 16 .05 -1.746 t 0
Confidence Interval for μUsing the t Distribution • The (1 – α)100% confidence interval for μ is • The value of t is obtained from the t distribution table for n – 1 degrees of freedom and the given confidence level.