Download
1 / 22
220 likes | 345 Vues
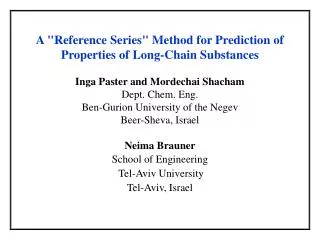
A "Reference Series" Method for Prediction of Properties of Long-Chain Substances Inga Paster and Mordechai Shacham Dept. Chem. Eng. Ben-Gurion University of the Negev Beer-Sheva, Israel Neima Brauner School of Engineering Tel-Aviv University Tel-Aviv, Israel. The Needs.

E N D
A "Reference Series" Method for Prediction of Properties of Long-Chain Substances Inga Paster and Mordechai Shacham Dept. Chem. Eng. Ben-Gurion University of the Negev Beer-Sheva, Israel Neima Brauner School of Engineering Tel-Aviv University Tel-Aviv, Israel
The Needs • Physical property data are extensively used in chemical process design, environmental impact assessment, hazard and operability analysis, and additional applications. • Measured property values are available only for a small fraction of the chemicals used in the industry, as reactants, products or side products. Long chain substances pose special challenges, as their critical constants cannot be measured because of thermal instability. • Currently Asymptotic Behavior Correlations (ABC) are used for predicting properties of long chain substances. • ABCs represent the change of properties as nonlinear functions of nC (and/or molecular mass).
Presently Used ABC Correlations 1. Marano and Holder, Ind. Eng. Chem. Res. 36, 1887 (1997) Y is the property, 5 or 6 adjustable parameters 2. Gao et al., Fluid Phase Equilibria, 179, 207(2001) 5 adjustable parameters: For many homologous series only a few, inaccurate property data points are available in the low carbon number range. The use of nonlinear models with adjustable parameters based on such data for long range extrapolation is very risky and unreliable.
Property Behavior at the limit nC → ∞* • Properties that approach a finite value for large carbon numbers (e.g., normal boiling and melting points, critical temperature). • Properties which are additive in nature, with a monotonic incremental change with increasing the nC. (e.g., critical volume, molar volume). • Consistency between different homologous series at the limit. The same property approaches the same value for different series. • In approaching the limit the difference between the property values for different homologs should monotonically decrease *Marano and Holder, Ind. Eng. Chem. Res. 36, 1887 (1997)
Related Previous Work* Development of (linear) QSPRs with good extrapolation capabilities for high carbon number (nC) substances in homologous series. Property Descriptor Methodology • Molecular descriptors collinear with a particular property are identified based on available experimental data. • From among these, the ones whose behavior at the limit nC → ∞ is similar to the property behavior are used for prediction. • A linear QSPR in terms of the selected descriptor, with an optional additional correction term which exponentially decays with nC, can be developed. *AIChE J, 57(2), 423–433 (2011)
The Objective of this Research To establish relationships between properties of areference series, for which the largest amount and the highest precision property data are available and the properties of atarget seriesfor which a smaller number and lower precision data points are available. To use this relationship in order to determine whether the propertydata available for the target series is sufficientfor obtaining reliable predictions. To use the relationship, if the test in (2) positive, in order to predict property data for the reference series byinterpolation and both short and long range extrapolations Various aspects of the proposed method will be demonstrated by predictingnormal boiling temperature(approaches a finite value for large carbon numbers) andcritical volume(monotonic incremental change with increasing carbon number.
Ideal Gas Enthalpy of Formation (Hf) for n-alkanes and n-mercaptans Source: DIPPR database (Rowley et al. 2010), experimental data in bold Hf decreases monotonically with increasing nC
Modeling the Hf data of n-alkanes with the linear QSPR: R2 = 0.999996 Used for model derivation The Hf of the reference series can be adequately represented as a linear function of nC for long range extrapolation
The relationship between n-Alkane and n-mercaptan, Hf data for 3 ≤ nC ≤ 12 Prediction by linear equation β0 = (3.772 ±0.12)E+07; β1 = 0.9986 ± 0.006; R2 = 0.9999 Proposed by Peterson, Ind. Eng. Chem. Res., 2010 , 3492-3495 The predicted and experimental data points are indistinguishable. The proposed relationships can be used for long range extrapolation
Normal Boiling Temperatures (Tb) for n-alkanes and n-alkanoic acids Source: DIPPR database (Rowley et al. 2010), experimental data in bold From various literature sources:
Fitting a Linear QSPR to the n-Alkane Tb data for 9 ≤ nC ≤ 20 The descriptor IVDE has the highest correlationwith the n-alkane Tb data. This descriptor belongs to the "information indices", and it can be calculated (for the n-alkane series from: The linear QSPR obtained: Tb = 917.8 (± 15.6) - 654.3(± 26.0) IVDE R2 = 0.9968 (Requirement [1071 K – 1091 K]
Fitting a Linear QSPR to the n-Alkane Tb data for 9 ≤ nC ≤ 20 In this case a linear QSPR cannot be used for long range extrapolation
Fitting a Nonlinear QSPR to the n-Alkane Tb data for 9 ≤ nC ≤ 20 β0 = 484.7 ± 11.9; β1 = -269.3 ± 11.4; β2 = 1/(45.1 ± 0.9) R2 = 0.999989 The nonlinear model represents both the available data and the asymptotic behavior excellently
The relationship between n-Alkane and n-Alkanoic acid Tb data for 3 ≤ nC ≤ 13 Prediction by linear equation β0 = 298.96 ± 5.79; β1 = 0.6157 ± 0.015; R2 = 0.999 The experimental data of n-alkanoic acids is smooth, the linear relationship can be used for interpolation and short range extrap.
The relationship between n-Alkane and n-Alkanoic acid Tb data for 3 ≤ nC ≤ 13 Prediction by the equation: β0 = 0.6393 ± 0.03; β1 = 0.2459 ± 0.04; β3 = 0.0232 ± 0.005; R2 = 0.99989 The nonlinear relationship represents adequately the available data and converges to the correct limiting value.
Prediction of Tb for a “Target” homologous series • Plot the available Tb data of the target series versus the corresponding n-alkane data. Based on the smoothness of the curve and the number of available data points determine whether long range extrapolation is feasible. • Use nonlinear regression to obtain the coefficients of the equation: • To predict Tbfor a member of the target seriesof a particular nC introducethe corresponding Tb dataof the n-alkane series (if available) or a predicted value obtained using the equations provided, into the above equation.
Special Challenges in (Long Chain) Property Prediction • Insufficient amount of property data for the reference and/or the target series • Available property data for the reference and/or the target series is too noisy. • The property value for nC → ∞*is not known • Phase change at the standard state (usually T = 298 K and P = 1 bar) appears at high nC with no corresponding property data are available. This may happen for properties specified at a standard state (For example: heat of combustion). The influence of the phase change must be considered in extrapolation.
Critical Volume (Vc) for n-alkanes and n-alkanoic acids Source: DIPPR database (Rowley et al. 2010), experimental data in bold Vc changes monotonically with increasing nC
Modeling the VC data of n-alkanes with the linear QSPR: Super-linear change with nC (Suggested by Marano, Gao et al.)
The relationship between n-Alkane and n-Alkene VC data for 3 ≤ nC ≤ 10 Prediction by linear equation β0 = 0; β1 = 0.9457 ± 0.006; R2 = 0.9995 The deviation of the DIPPR pred. data can be explained by the high unceratainty (up to 25%) of these data.
Checking the Consistency of the Available VC data for the Target Series Slope = 1-0.946 = 0.054 Slope = unclear The plot of VCr – VCt versus VCt should yielda straight line with slope of (1-β1) for consistent data
Conclusions • For properties that approach a finite value for large nC a linear function of the descriptor with the highest correlation with the available data often able to provide good predictions only for interpolation and short rage extrapolation. A nonlinear expression containing the descriptor and the property value at nC → ∞*, that provides good prediction in long range extrapolation, has been developed. • The linear relationship between properties of corresponding members of different homologous series, may be valid only locally. A new nonlinear relationship which holds in very wide ranges has been developed. • It has been shown that the reference series approach enables optimal utilization of the available property data for checking the consistency of such data and prediction of properties in the short and long range.