Download
1 / 1
10 likes | 137 Vues
Numerical Modelling of Needle-Grid Electrodes for Negative Surface Corona Charging System Y. Zhuang *, G. Chen and M. Rotaru University of Southampton, Southampton, UK. Simulation Results. Introduction.

E N D
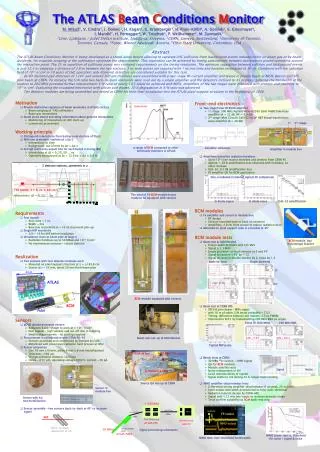
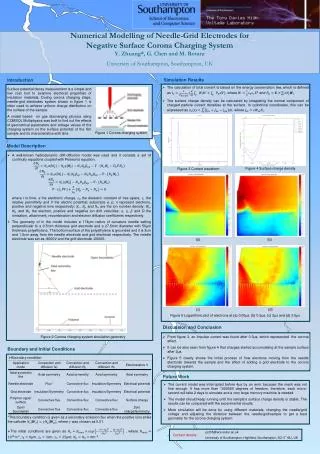
Numerical Modelling of Needle-Grid Electrodes for Negative Surface Corona Charging SystemY. Zhuang*, G. Chen and M. RotaruUniversity of Southampton, Southampton, UK Simulation Results Introduction • The calculation of total current is based on the energy conservation law, which is defined as , where and . • The surface charge density can be calculated by integrating the normal component of charged particle current densities at the surface. In cylindrical coordinates, this can be expressed as , where . Surface potential decay measurement is a simple and low cost tool to examine electrical properties of insulation materials. During corona charging stage, needle-grid electrodes system shown in figure 1 is often used to achieve uniform charge distribution on the surface of the sample. A model based on gas discharging physics using COMSOL Multiphysics was built to find out the effects of geometrical parameters and voltage values of the charging system on the surface potential of the film sample and its characteristics with time. Figure 1 Corona charging system Model Description • A well-known hydrodynamic drift-diffusion model was used and it consists a set of continuity equations coupled with Poisson’s equation. • where t is time, e the electronic charge, the dielectric constant of free space, the relative permittivity and V the electric potential; subscripts e, p, n represent electrons, positive and negative ions respectively; , and are the ion number density; , and the electron, positive and negative ion drift velocities; , , and D the ionisation, attachment, recombination and electron diffusion coefficients respectively. • The geometry of in the model includes a 174µm radius of curvature needle setting perpendicular to a 0.5mm thickness grid electrode and a 27.5mm diameter with 50µm thickness polyethylene. The bottom surface of the polyethylene is grounded and it is 3cm and 1.5cm away from the needle electrode and grid electrode respectively.The needle electrode was set as -8000V and the grid electrode -2000V. Figure 4 Surface charge density Figure 3 Current waveform (a) (b) (d) (c) Figure 5 Logarithmic plot of electrons at (a) 0.05µs, (b) 0.5µs, (c) 2µs and (d) 3.5µs Discussion and Conclusion Figure 2 Corona charging system simulation geometry • From figure 3, an Impulse current was found after 0.3µs, which represented the corona effect. • It can be also seen from figure 4 that charges started accumulating at the sample surface after 2µs. • Figure 5 clearly shows the initial process of how electrons moving from the needle electrode towards the sample and the effect of adding a grid electrode to the corona charging system. Boundary and Initial Conditions • Boundary condition Future Work • The current model was interrupted before 4µs by an error because the mesh was not fine enough. It has more than 1000000 degrees of freedom, therefore, each micro-second will take 2 days to simulate and a very large memory machine is needed. • The model should keep running until the sample’s surface charge density is stable. The results can be compared with the experimental results. • More simulation will be done by using different materials, changing the needle/grid voltage and adjusting the distance between the needle/gird/sample to get a best geometry for the corona charging system. • *This boundary condition is given as a secondary emission flux when the positive ions strike the cathode , where was chosen as 0.01. • The initial conditions are given as , where m-3, µm, cm, µm; . yz205@ecs.soton.ac.uk University of Southampton, Highfield, Southampton, SO17 1BJ, UK Contact details :