Soil Texture, Particle Size Distribution and Soil Classification
1.64k likes | 4.22k Vues
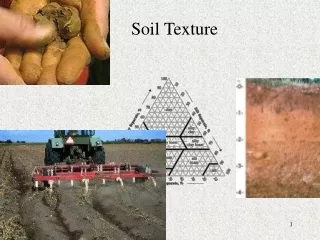
3. Hillel, pp. 63-69. Soil Texture, Particle Size Distribution and Soil Classification. Soil Texture. SOIL TEXTURE is defined by size distribution or mass fractions of soil primary particles (individual grains and particles).

Soil Texture, Particle Size Distribution and Soil Classification
E N D
Presentation Transcript
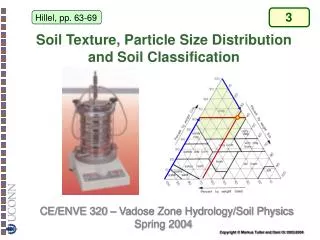
3 Hillel, pp. 63-69 Soil Texture, Particle Size Distribution and Soil Classification
Soil Texture SOIL TEXTUREis defined by size distribution or mass fractions of soil primary particles (individual grains and particles). • Primary mineral particles formed through physical and chemical weathering of parent material and refractory organic substances make up the solid phase. • Particle size distribution and shape are the most important characteristics affecting: - pore geometry - total pore volume (porosity) - pore size distribution - solid surface area
Methods to Determine Particle Size Distribution • Sieving methods– soil particles 0.05 mm (sand fraction) we use Sieving methods. • Sedimentation methods • Pipette • Hydrometer • X-ray attenuation • Particle counting methods • Light, SEM Microscopy • Coulter method • Laser/Light diffraction methods
Sieving Methods For particles 0.05 mm (sand fraction) we apply SIEVING methods. Results are expressed as particle diametersNote - particles are rarely spherical, hence these diameters should be regarded as effective diameters based on sieve opening size. Sieve Shaker
Particle Size Distribution - Sedimentation • For particles ≤ 0.05 mm (silt and clay fractions) sedimentation methods based on Stokes law are used to deduce particle size distribution. • Soil particles settle in aqueous solution attaining terminal velocities proportional to their mass and size. • The amount of suspended soil after a given settling time is used to determine particle size fractions. • The amount of soil in suspension is determined by either extracting a sample by the pipette methodor from a direct hydrometer reading.
Stokes Law • Three forces acting on a spherical particle. • Buoyancy and drag forces act against the gravitational force. • A spherical soil particle D=5 um reaches 99% of its terminal velocity in aqueous solution within 0.017 ms, and for D=1 mm the time is 0.68 s. Buoyancy Force(weight of displaced liquid) Drag Force (exerted bythe surrounding liquid) Gravitational Force
Stokes Law The three forces acting upon the settling particle quickly equilibrate and the particle reaches a constant settling velocity.We can solve the force balance equation to obtain the settling velocitySince we know that velocity equals length per time we can calculate the time particles of a certain size need to settle through a distance h: t is the time required for particles of a certain size to settle below a certain depth h.
Stokes Law - Limitations When applying STOKES law we need to be aware of a number of simplifying assumptions: - Particles are large enough to be unaffected by the thermal (Brownian) motion of the fluid molecules • All particles are rigid, spherical, and smooth • All particles have the same density • The suspension is dilute enough that particles do not interfere with each other • Fluid flow around the particles is laminar. That means no particle exceeds the critical velocity for the onset of turbulence In practice we know that soil particles are neither spherical nor smooth.Hence the diameter calculated from STOKES law does not necessarily correspond to the actual dimensions of the particles.We rather receive an effective or equivalent settling diameter
Soil particles are not spherical • Relative settling velocities of triaxial ellipsoids (L=long, I=intermediate, & S=short axis) relative to spherical particle of equal volume (Matthews, 1991).
Sedimentation – Pipette Method Typical experimental setup for the pipette method Cylinder withsuspended sample
Sedimentation – Hydrometer Method The concentration (density) of suspended particles is measured directly with a calibrated Hydrometer at certain time intervals. The hydrometer settling depth h’ is dependent on the concentration R in g/l of the pure Sodium pyrophosphate solution and the shape and design of the hydrometer. For the ASTM 152H Hydrometer h’=-0.164R+16.3 [cm]. When h’ is known we can calculate settling times as:
After 67 sec After 11.6 hrs Sedimentation – Hydrometer Method Start Only Silt and Clayparticles arein suspension Only Clayparticles arein suspension All particles arein suspension
Settling Times - Example Use Stokes' law to calculate the time needed for: (a) sand particles (diameter >50mm) and (b) silt particles (>2mm) to settle to a depth of 0.2 m in an aqueous suspension at 25oC. Sand d > 0.00005 m Units Dimensional Analysis
Settling Times - Example Stokes Law Silt d > 0.000002 m
Modern methods for particle size analyses New methods are now available (powder technology, etc.) - Optical Microscopy - Transmission/Scanning Electron Microscopy - X-ray attenuation - Particle counting (Coulter method) - Light Scattering and Laser Diffraction Methods
Laser Diffraction Modern methods for particle size analyses (2) Light Scattering and Laser Diffraction Methods: • Particles of a given size diffract light at a certain angle that increases with decreasing particle size. • Particle size distribution is inferred from light intensities measured at the detector as a function of the angle based on the Mie theory.
Modern methods for particle size analyses (3) X-ray attenuation (SediGraph) • A fine collimated x-ray beam passes through suspension • The cell is lowered relative to the beam and relative solid concentrations at different levels and times is measured. • Determines particles less than 1mm in 10 min.
Modern methods for particle size analyses (4) Coulter method • Counting particles passing through a sensing zone induce a perturbation. • Coulter method is based on passage of particles suspended in an electrolyte through a small orifice with electrodes on each side • Changes in electrical impedance are proportional to the volume of particles. • Measurement range of 0.6 to 1200mm.
Particle-Size Diagram • Particle size distribution (PSD) is often expressed as particle diameter as a function of soil mass fraction of smaller particles. • The curve is equivalent to cumulative statistical distribution of particle diameters in the sample (note log scale for particle sizes).
Comparison of methods for PS analyses • Six methods for particle size analysis were compared in recent study by Wu et al. (1993). • The agreement between the various methods in the data depicted is surprising considering the different physical principles and interpretation techniques behind each method.
Particles < 0.002 mmCLAY Particles 0.002 mm and < 0.05 mmSILT Particles 0.05 mm and < 2 mmSAND Particles 2 mmGRAVEL Particle Size Distribution - Classification • Soils are classified according to their particle size distributions. • Classification schemes lump detailed information on particle size distributions into fractions of clay, silt, sand, and gravel. • A commonly used scheme is the USDA classification scheme that defines the following fraction limits:
Particle Size Distribution - Classification USDA CLASSIFICATION Particles < 0.002 mmCLAY Particles 0.002 mmand < 0.05 mmSILT Particles 0.05 mmand < 2 mmSAND Particles 2 mmGRAVEL
Sand = 100-93 = 7% Silt = 93-61 = 32% Clay = 61% Particle-Size Diagram 93% of the total sample < 0.05 mm 61% of the total sample < 0.002 mm 100% < 2 mmNo Gravel From available particle size diagrams we can determine the particle fractions as shown for the clay soil above.
Sand = 100-93 = 7% Silt = 93-61 = 32% Clay 61% Textural Triangle (USDA Classification) After the fractions (sand, silt, and clay) are determined we use the USDA textural triangle to determine the soil textural class.
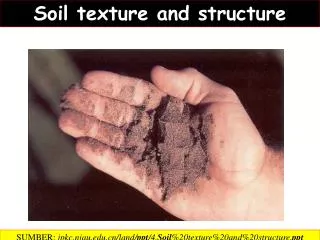
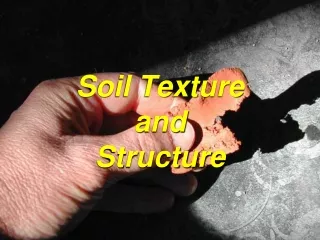
Field Determination of Soil Texture Soil textural classification may be completed in the field for applications that do not require accurate quantitative determinations. The basic approach is to hand-evaluate soil properties including the ability to form a “ribbon”, grittiness, stickiness, plasticity, and behavior of “casts” formed by squeezing. Experienced individuals may often resolve textural classes (sand, silt, clay) to within only a few percent of those derived from other techniques, and samples can be processed rather rapidly.
Field Determination of Soil Texture Flow chart for the “texture-by-feel” method.
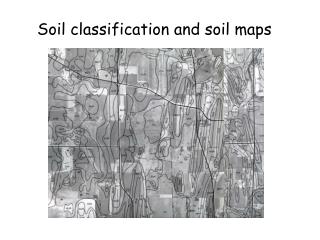
Why do we need to classify soil types? • To compress detailed PSD information into an informative “index”. • To aggregate and create map units with similar soil properties for land use planning - farming, irrigation, construction, etc. • Develop predictive capabilities for hydrological and other applications.
Particle Size Distribution - Example One kilogram of soil was passed through the following series of sieves with the weights found on each sieve: The soil that did not pass through the largest sieve was collected in a pan. 40 g of the original sample was then tested by the sedimentation method at 25oC. Hydrometer readings in a 1 liter aqueous suspension (after subtracting the blank reading of 2 g/l) were converted to effective diameters (m) as shown in the following table: • Find the soil’s Sand, Silt, and Clay contents, and its USDA textural class. • Use all the information to draw a particle size distribution diagram (use semi-log scale)
Particle Size Distribution - Example The first step is to convert the weight in g that passes a certain “sieve” to cumulative %. The hydrometer readings are related to 40 g of the original sample of 1 kg. E.g. a hydrometer reading of 17 g/l gives
Particle Size Distribution - Example USDA textural classThe USDA classification only considers particle fractions smaller than 2 mm. Since 16% of the particles of our sample are larger 2 mm, we have to modify the values calculated on the previous slide. Sand [%] = 41.5 * (100 / 84) = 49.4Silt [%] = 30.0 *(100 / 84) = 35.7Clay [%] = 12.5 *(100 / 84) = 14.9 !
Particle Size Distribution - Example Particle Size Diagram Log-Scale
Hillel, pp. 69-72 Specific Surface Area of Soil Particles
Surface Area • The large interfacial area per unit volume in soils give rise to liquid-solid interactions and adsorption of water & chemicals. • The soil clay fraction dominates soil specific surface area. Clay ~ 800 m2/g Sand ~ 0.01-10 m2/g
Specific Surface Area of Soil Particles Specific surface area is a fundamental and intrinsic property of soils that correlates with important phenomena like: - Cation exchange - Adsorption and Release of Chemicals - Swelling - Water Retention - Soil Plasticity, Cohesion, and Strength
Specific Surface Area of Particles - Definitions The specific surface are of soil particles may be defined as:- Total Surface Area per Unit of Mass of ParticlesAm=As/Ms [m2/g] - Total Surface Area per Unit of Volume of Particles Av=As/Vs [m2/m3] - Total Surface Area per Unit of Volume of Soil Ab=As/Vt [m2/m3] Specific surface area depends primarily on size, shape, and surface roughness of particles.
Specific surface area of regular particles The shape of sand and silt-sized particles is commonly idealized by smooth spheres. The specific surface of a spherical particle [Surface Area/Mass] is calculated as: The shape of clay particles is commonly idealized with smooth disk-shaped platelets with specific surface area given as:
Calculations for regular particles Calculated specific surface areas for idealized soil particles
Calculations for Smooth and Spherical Particles Specific surface area calculations assuming smooth and spherical particles may lead to serious underestimation of actual surface area as shown by Borkovec et al. [1993].
Small particles dominate soil SA Comparison of particle size distribution and associated contribution to soil surface area (Borkovec et al., 1993) Surface Area PSD 100 um
Estimation Based on Clay Fraction & Mineralogy Specific surface can be estimated from the clay fraction and mineralogy (Or and Wraith, 1999).
Estimation Based on Clay Fraction & Mineralogy For Montmorillonite-Kaolinite dominated clay fractions we can estimate specific surface area according to: Am [m2/g] = 5.65 Clay% - 18.9 For Kaolinite-Illite dominated clay fractions:Am [m2/g] = 1.87 Clay% + 6.0
Specific Surface Area – Measurement Methods Gas adsorption isotherms are measured with automated surface area analyzers. Nitrogen gas N2 is commonly used for gas adsorption
Specific Surface Area – Measurement Methods RETENTION OF POLAR LIQUIDS(Ethylene Glycol Monoethyl Ether (EGME) – Method) First we saturate an oven-dry soil sample with EGME. Then we evaporate excess EGME in an evacuated system.The evaporation rate decreases when all free EGME is gone and only that adsorbed monolayer is left.From measurements and theoretical considerations for pure Montmorillonite we know that 0.000286 g EGME is required to cover 1 m2 of clay with one monolayerFrom weighing the dry sample and the EGME treated sample in consecutive time steps until it attains a constant mass we can determine the mass of adsorbed EGME.
Polar Polar Non-polar Polar Specific Surface Area – Measurement Methods Non-polar (N2) probe molecules measure only external surface area because they are not able to access crystallographic planes of expandable clay minerals or complex organic structures.Polar molecules penetrate interlayer surfaces providing a measure of both internal and external surface area. Source: Pennell, K.D., Specific Surface Area, in Methods of Soils Analysis: Part 4, Physical Methods., edited by J.H. Dane, and G.C. Topp, pp. 295-315, SSSA, Madison, WI, 2002.