Download
1 / 1
20 likes | 259 Vues
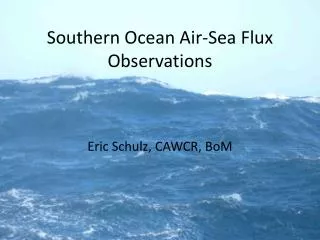
Synthesis of Air-Sea Flux CO2 Flux Observations: Comparison with the NOAA COAREG3.1 Community Flux Algorithm. Sea-air trace gas fluxes are represented by simple bulk relationships. α x =Gas solubility in seawater k x =Transfer velocity for gas X

E N D
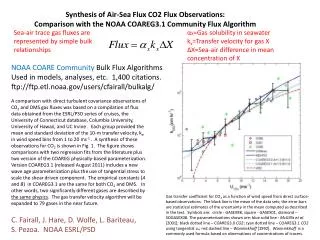
Synthesis of Air-Sea Flux CO2 Flux Observations: Comparison with the NOAA COAREG3.1 Community Flux Algorithm Sea-air trace gas fluxes are represented by simple bulk relationships αx=Gas solubility in seawater kx=Transfer velocity for gas X ΔX=Sea-air difference in mean concentrationof X NOAA COARE Community Bulk Flux Algorithms Used in models, analyses, etc. 1,400 citations. ftp://ftp.etl.noaa.gov/users/cfairall/bulkalg/ A comparison with direct turbulent covariance observations of CO2 and DMS gas fluxes was based on a compilation of flux data obtained from the ESRL/PSD series of cruises, the University of Connecticut database, Columbia University, University of Hawaii, and UC Irvine . Each group provided the mean and standard deviation of the 10-m transfer velocity, kx, in wind speed bins from 1 to 20 ms-1 . A synthesis of these observations for CO2 is shown in Fig. 1. The figure shows comparisons with two regression fits from the literature plus two version of the COAREG physically-based parameterization. Version COAREG3.1 (released August 2011) includes a new wave age parameterization plus the use of tangential stress to scale the shear driven component. The empirical constants (A and B) in COAREG3.1 are the same for both CO2 and DMS. In other words, two significantly different gases are described by the same physics. The gas transfer velocity algorithm will be expanded to 79 gases in the near future. Gas transfer coefficient for CO2 as a function of wind speed from direct surface-based observations. The black line is the mean of the data sets; the error bars are statistical estimates of the uncertainty in the mean computed as described in the text. Symbols are: circle - GASEX98, square - GASEX01, diamond – SOGASEX08. The parameterizations shown are: blue solid line - McGillis et al. [2001]; black dotted line – COAREG3.0 CO2; cyan dotted line – COAREG3.1 CO2 using tangential u*; red dashed line – Wanninkhoff[1992]. Wanninkhoff is a commonly used formula based on observations of concentrations of tracers. C. Fairall, J. Hare, D. Wolfe, L. Bariteau, S. Pezoa. NOAA ESRL/PSD