Download
1 / 13
130 likes | 317 Vues
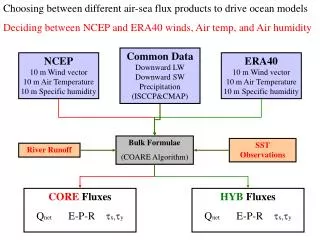
Southern Ocean Air-Sea Flux Observations . Eric Schulz, CAWCR, BoM. Motivation. The Southern Ocean is large (22% of world ocean) and is expected to play a significant role in the global climate system Role in the carbon, heat and mass cycle?

E N D
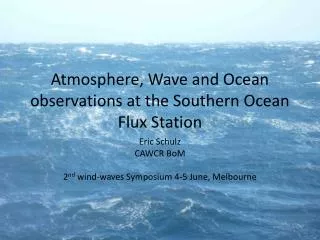
Southern Ocean Air-Sea Flux Observations Eric Schulz, CAWCR, BoM
Motivation • The Southern Ocean is large (22% of world ocean) and is expected to play a significant role in the global climate system • Role in the carbon, heat and mass cycle? • Very few in situ observations due to harsh and remote nature • Poorly constrained for these air-sea fluxes • How much carbon is trapped in the deep ocean? • How much heat absorbed, transported and released? • The Sub-Antarctic Zone occupies half of the Southern Ocean and is a region of extensive surface water subduction The Centre for Australian Weather and Climate ResearchA partnership between CSIRO and the Bureau of Meteorology
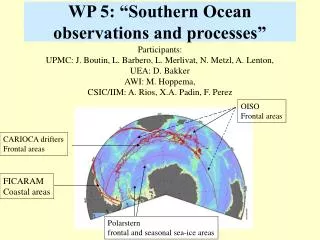
Observation Programs • IMOS funded, lead by the Bureau • Data freely available • 3 research vessels, broad spatial coverage but patchy in time and space • 1 mooring, 1 location, continuous presence • Collaboration and piggybacking (mooring) encouraged • Mooring program uses MNF vessel for annual visits
Southern Ocean Time Series Sustained Ocean observatory • Multidisciplinary (met ,ocean, bio-geo-chemical (BGC) • Multiple platforms • SAZ mooring (sediment traps) – transfer of carbon to deep ocean • Pulse mooring (BGC) – consumption of CO2 in mixed layer • SOFSmooring (weather, fluxes, CO2 physical ocean) – physical fluxes through ocean surface • Gliders(physical and BCG) – spatial context & vertical profiles • Drifting Profilers (physical and BGC) – spatial context & vertical profiles
SOTS Location Southern Ocean Time Series Observatory Funded by IMOS Operated by Bureau, CSIRO & UTAS 3 Moorings Gliders & Profiling Floats 46.75oS, 142oE 350 NM SW of Tasmania Sub-Arctic Zone with strong biological activity Situated centrally in the Sub Antartic Zone, Australian sector of the Southern Ocean Pilot deployment flux buoy at 60S 140E, 2012, JAMSTEC SOTS 47S 142E SOFS and JAMSTEC 60S mooring locations in Australian sector of the Southern Ocean. The Centre for Australian Weather and Climate ResearchA partnership between CSIRO and the Bureau of Meteorology
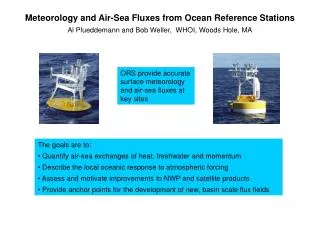
SOFS Observations • Wind • Air Temperature & Humidity • Long- & Short-wave Radiation • Rain • Pressure • PAR, • pCO2 • Waves • SST & salinity • BGC • Oxygen • Fluorescence • Sub-surface 10-500m • Temperature • Salinity • PAR • Pressure • Currents • Particle size Short- & Long-wave radiation Wind Temperature & Humidity Precipitation Air pressure Tower and instruments The Centre for Australian Weather and Climate ResearchA partnership between CSIRO and the Bureau of Meteorology
Data availability 1998-2012 Started with SAZ sediment traps in 1997 Added Pulse BGC in 2009 – summer only, annual since 2011 Added SOFS in 2010 Dedicated profilers (2005) & gliders (2010) halted in 2011 with technical issues Gaps in SAZ are due to Instrument and mooring failures The Centre for Australian Weather and Climate ResearchA partnership between CSIRO and the Bureau of Meteorology
SOFS example observations: Wind speed and Solar Radiation 9-month refurbishment gap Between SOFS 1 & 2, now back-to-back deployments Winds peaking ~50kts Distinct solar radiation annual cycle SOFS3 data is hourly real-time, so less variability than SOFS1&2 Buoy Refurbishment The Centre for Australian Weather and Climate ResearchA partnership between CSIRO and the Bureau of Meteorology
SOFS applications: Air-Sea Fluxes Bulk Fluxes from SOFS-1, March 2010- March 2011 Net deployment ocean cooling of 10 Wm-2 Asymmetric seasonal signal in Net Incoming SW dominates seasonal signal Severe short-term ocean turbulent cooling events (>400 Wm-2) with cold, dry southerly winds. Frequent ocean heating events from Hs Ocean heat content shows trend agreement with air-sea flux on seasonal scale. See: Schulz et al. 2012, GRL. The Centre for Australian Weather and Climate ResearchA partnership between CSIRO and the Bureau of Meteorology
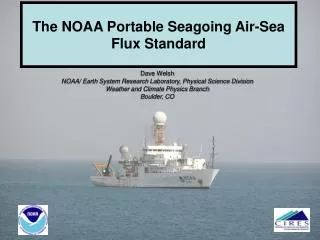
Ship Observations • IMOS Underway ship flux facility • Provides instruments to complete existing sensor suite, data telemetry & processing, routine calibration and real-time quality controlled data delivery • Recruited • Southern Surveyor, April 2008 • Aurora Australis, September 2010 • Tangaroa, April 2011
Ship Instrumentation • Rain • Wind • Air Temperature & Humidity • Pressure • PAR • pCO2 • SST & salinity • Currents • Long- & Short-wave Radiation • 1-minute averages telemeterd every 1-3 hours. • Automated QC of observations and generate flux products and delivered to IMOS ocean portal • Equipment will be transferred from Surveyor to Investigator The Centre for Australian Weather and Climate ResearchA partnership between CSIRO and the Bureau of Meteorology RV Southern Surveyor
4ox4o Gridded net heat flux 2008-2012 Summer: Oct-April Winter: May-Sept (+ve = ocean cooling)