
Ocean Observations for Climate: Progress, Challenges, and Applications
Explore the significance of ocean monitoring in climate prediction, carbon cycle, and more. Learn about advancements in ocean observations and the challenges faced.

Ocean Observations for Climate: Progress, Challenges, and Applications
E N D
Presentation Transcript
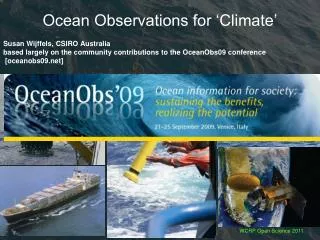
Ocean Observations for ‘Climate’ Susan Wijffels, CSIRO Australia based largely on the community contributions to the OceanObs09 conference [oceanobs09.net]
Why do we care? • The oceans are the fly wheel of the climate system • Ocean thermal inertia is a key source of climate predictability – the longer the prediction time the deeper we have to measure • Ocean fluxes dominate the global hydrological cycle • Oceans play a key role in the global carbon cycle • They are a major source of protein for many nations • Growth in our energy supplies are coming from the ocean: offshore oil and gas
Key Applications • Initialization and testing of seasonal through decadal prediction • Improving climate scenarios/projections • Detection/Attribution of climate change and extreme events • tracking the global carbon balance • Ocean mesoscale and its impacts on local weather and climate • Short term ocean forecasting – marine industry operations/oil spill tracking/search and rescue • Managing marine resources (fisheries/aquaculture)
The Generic Challenges • Sustaining core existing systems – building on progress • Filling major gaps: increased coverage; increased resolution; richness • Reconstructing the climate record: retrieving past data: data archaeology, digitisation, quality-control, bias removal • Transitioning systems built for short term forecasting to service the needs of climate monitoring/prediction • Provide clear and timely information on the state of the ocean and climate system: contributing to climate services
Progress in the last 10 years • Major improvements in the reach and seasonal coverage of broadscale ocean profile returns - Argo • First global salinity monitoring capability –Argo+Aquarius • Re-tasking of the XBT network from broadscale mode to transport monitoring • Expansion of coverage of the Tropical Moored Array to cover all tropical oceans • Improvement in the global distribution and number of surface drifters for SST • Continuous high precision satellite altimetry since 1992 • GHRSSTProject – reinvigorated the science of SST estimation – new and better SST products (with errors) • Established ongoing global repeat hydrography-GOSHIP • We have the bones of an ocean carbon observation network
Progress: the implementation of Argo- uniform global/seasonal coverage – extend reach from 700m to 2000m January 1991 700m T only January 2009 2000m T and S
We have a global ocean salinity observing system for the first time http://www.jamstec.go.jp/ARGO/argo_web/prod/oi_prs_e.html
Progress: surface salinity from space – a promising new capability NASA
Progress: Retaskingof the XBT network to monitor the circulation and boundary currents • Complement Argo/altimetry • Transport monitoring, mesoscale resolving • Several lines are reaching past 20 years of sustained sampling giving precious insight into decadal variability increasing Tasman Front PX30 PX06 East Australian Current Year PX34 From Ken Ridgway, CSIRO
Progress: Tropical Moored Array expands into the Indian and Atlantic Oceans 1990 2009 McPhadenet al, 2011
Progress: Steady growth and better global coverage of in situ SST returns • Largely achieved through growth of surface drifter array January 1991 January 2009
Progress: Global High Resolution-SST Project • Re-engaging the research community in the science of SST measurement • Exploiting multi-satellite/sensor mission • Community consensus approaches to satellite/in situ synthesis and error estimation
Progress: repeat hydrographic program established - GOSHIP • Detecting widespread and rapid bottom water warming Johnson and Doney, 2006 Sloyan and Wijffels.
Progress: Surface pCO2 measurement network expanded http://cdiac.ornl.gov/oceans/LDEO_Underway_Database/
Progress: Time Series for Ocean Carbon – very sparse network
Retrieving the climate record: tracking down biases in ocean profile data Uncorrected for XBT biases Corrected for XBT biases
Retrieving the climate record: biases in ocean profile data Expendable Bathy Thermograph (XBT) data are subject to both thermal and depth biases – now several correction schemes proposed but none appear regionally consistent or agree with each other. + co-located pair data set being assembled and analysed + need QC problem tackled properly – little progress so far From Bec Cowley,2011
Retrieving the climate record: biases in ocean profile data Pressure drift in raw senser output Instrument pressure biases in Argo have now been tracked and removed Demonstrated of the need to retain key meta-data and track data quality as the system is ‘live’
Progress: started to resolve the ocean mesoscale and its impacts on weather and climate Completely dependent on mesoscale-resolving satellite missions: altimetry, ocean vector winds, SST Goni et al, 2011
Key Actions: sustain Can we maintain these advances? + use more efficient technologies + grow the number of contributing countries Is their any gross redundancy in the system? None identified so far – and a little redundancy is needed to ensure robustness and to detect platform biases.
Gaps: seasonal and fast ice zone • Area of most rapid change • little subsurface profile data – winter climatology poorly known let alone the variability • difficulty in using satellite data streams here Ice profilers and ice-capable floats present an affordable path forward – many successful pilot deployments Donlon et al, 2011
Gaps: the deep ocean is changing but is very sparsely monitored • Develop and pilot broad-scale deep ocean monitoring technologies to inform a global future strategy. Optimize the mix of deep moorings, deep profiling floats and gliders, ocean acoustic thermometry Dushaw et al, 2009
The Future Science Challenges Decadal Prediction • Is Argo enough to initialise these systems? Do we need to go deeper? • How do we validate? Likely need decadal records of key element of the global ocean circulation. We need to start measuring now. Mesoscalecoupling of the atmosphere and ocean: • Heavy dependence on satellite winds and sea level measurements – need to sustain these capabilities • Need mesoscale resolving observations to challenge these systems e.g. gliders, XBT high density lines, moorings • Growing recognition of the importance of surface waves – what observations are needed?
The Future Science Challenges Ocean carbon Essential for constraining Earth System Models: but we are a far cry from real-time inventory tracking • Can other technologies help with a broadscale system e.g. new sensors on floats? • How can we better utilise ocean colour in constraining the global carbon cycle? Climate and anthropogenic impacts on marine ecosystems: • Lack a framework for monitoring marine ecosystems – still in ‘discovery mode’ – exception is plankton monitoring • How do we combine the climate and ecosystem needs in a single observing system? Can we track rate and impacts of ocean acidification?
Thanks to the organisers and contributors to OceanObs09 www.oceanobs09.net