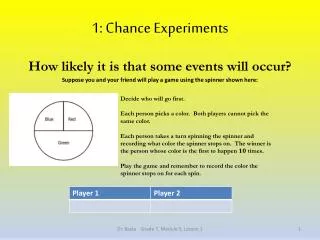
1. Observations and random experiments
1. Observations and random experiments. Observations are viewed as outcomes of a random experiment. Observations. Observation random experiment (controlled) Outcome cannot be predicted with certainty Range of possible outcomes known

1. Observations and random experiments
E N D
Presentation Transcript
1. Observations and random experiments Observations are viewed as outcomes of a random experiment.
Observations • Observation random experiment (controlled) • Outcome cannot be predicted with certainty • Range of possible outcomes known • With each outcome of an observation may be associated a unique numeric value • The outcome variable, X, is a random variable because, until the experiment is performed, it is uncertain what value X will take. • To quantify this uncertainty, probabilities are associated with values (x) of the R.V. X (and outcomes of experiment)
Continuousrandom variables • Normal r.v. probit model • Logistic r.v. logit model • Uniform r.v. waiting time to event • Exponential r.v. waiting time to event • Gompertz r.v.
Gaussian probability model Time at event follows a normal distribution with mean and variance 2 (random variable is normally distributed)
Normal distribution: density With the mean and 2 the variance Linear predictor:
Link function The link function relates the linear predictor to the expected value of the datum y (McCullagh and Nelder, 1989, p. 31) =
Standard normal density With = 0 the mean and 2 = 1 the variance The probit model relies on a standard normal distribution (cumulative): it is the INVERSE of the standard normal
Cumulative normal distribution Approximation by Page (1977) where Page, E. (1977) Approximations to the cumulative normal function and its inverse for use on a pocket calculator. Applied Statistics, 26:75-76 Azzalini, 1996, p. 269
Excel: NORMDIST Returns the normal cumulative distribution for the specified mean and standard deviation. Syntax: NORMDIST(x,mean,standard_dev,cumulative) X is the value for which you want the distribution. Mean is the arithmetic mean of the distribution. Standard_dev is the standard deviation of the distribution. Cumulative is a logical value that determines the form of the function. If cumulative is TRUE, NORMDIST returns the cumulative distribution function; if FALSE, it returns the probability mass function. Example: NORMDIST(42,40,1.5,TRUE) equals 0.90879 NORMDIST(42,40,1.5,FALSE) equals 0.10934
SPSS RV.NORMAL COMPUTE variable = RV.NORMAL (mean, standard deviation) COMPUTE test = RV.NORMAL(24,2) . CDF.NORMAL Returns the cumulative probability that the a value of a normal distribution with given mean and standard deviation, will be less than a given quantity Q. COMPUTE variable = CDF.NORMAL(Q,mean,standard deviation) COMPUTE test2 = CDF.NORMAL(24,24,2) . Test2 = 0.50
Inverse of standard normal cumulative distribution The probit is the value zp from the normal distribution for which the cumulative distribution is equal to a given probability p.
Excel: NORMSINV Inverse of standard normal cumulative distribution NORMSINV: Probability is a probability corresponding to the normal distribution. NORMSINV uses an iterative technique for calculating the function. Given a probability value, NORMSINV iterates until the result is accurate to within ± 3x10^-7. If NORMSINV does not converge after 100 iterations, the function returns the #N/A error value. Example: NORMSINV(0.908789) equals 1.3333 E.g. (z) = 0.025 for z = -1.96 Probit(0.025) = -1.96 (z) = 0.975 for z = 1.96 Probit(0.975) = 1.96
SPSS: IDF.NORMAL Returns the value from the normal distribution for which the cumulative distribution is the given probability P. COMPUTE variable = IDF.NORMAL(P,mean,stddev) COMPUTE test3 = IDF.NORMAL(0.025,24,2) . Test3 = 20.08 IDF.NORMAL (0.5,24,2) = 24
Example 1. Age at migration • A sample of 20 males and 20 females • Sample generated on computer: random number generator
Example 1 Random sample of 20 males and 20 females: Age at migration E:\f\life\rnumber\normal\mig\2.xls
Frequency table and diagram (SPSS)
Example 1 SPSS linear regression: y = a + b x (y = age, x = sex) 1 = 24.3 for males 2 = 24.3 - 3.1 = 21.2 for females Cte: Lower bound: 24.3 - 1.96 * 0.535 = 23.2 Upper bound: 24.3 + 1.96 * 0.535 = 25.4 : Lower bound: -3.1 - 1.96 * 0.757 = -4.6 Upper bound: -3.1 + 1.96 * 0.756 = -1.6
Random number generationAge at migration200 respondents • Normal random number in SPSS • COMPUTE variable = RND(RV.NORMAL(24,2)) . • Logistic random number in SPSS • COMPUTE variable = RND(RV.LOGISTIC(24,2)) . • Create frequency table in SPSS
Random number generation (SPSS)Age at migration200 and 2000 respondents COMPUTE NORMAL1 = RND(RV.NORMAL(24,2)) . VARIABLE LABELS normal1 "NORMAL N(24,4)". VARIABLE WIDTH normal1 (6) . COMPUTE LOGIST = RND(RV.LOGISTIC(24,2)) . VARIABLE LABLES logist "LOGISTIC L(24,1)". VARIABLE WIDTH logist(6). COMPUTE ONE = 1 . /* Table of Frequencies. TABLES /FTOTAL $t 'Total' /* INCLUDE TOTAL /FORMAT BLANK MISSING('.') /TABLES (LABELS) + $t BY one > ( normal1 + logist ) /STATISTICS COUNT ((F5.0) 'Count' ) .
Age at migration 200 respondents N(mean, variance) = N(24,4) L(mean, scale parameter) = L(24,1)
Age at migration 2000 respondents N(mean, variance) = N(24,4) L(mean, scale parameter) = L(24,1) Theoretical logistic: lambda = 1/1.81
Example 2 SPSS
Example 3 Heaping!
2. The logistic modelDuration = logistic r.v.Time at event = logistic r.v.
Standard logistic distribution Probability of being in category 1 instead of categ. 0: Cumulative distribution: Probability density function: With (logit) the linear predictor ‘Standard’ logistic distribution with mean 0 and variance 2 = 2/3 3.29 hence = 1.81 The logit model relies on a standard logistic distribution (variance 1 !)
‘Standardised’ logistic distribution Cumulative distribution: Probability density function: =/3 1.8138 = 1.8138 Standardized logistic with mean 0 and variance 1
Link function The link function relates the linear predictor to the expected value p () of the datum y (McCullagh and Nelder, 1989, p. 31) Logit: = logit(p) = ln [p/(1-p)]
Link functions Translate probability scale (0,1) into real number scale (-,+ ) Logit E.g. logit(0.25) = -1.0986 logit(0.1235) = -1.96 logit(0.8765) = 1.96 Probit E.g. (z) = 0.025 for z = -1.96 Probit(0.025) = -1.96
Demography:Uniform and exponential distributions of events [in an(age) interval]Probability densityIntensity
3. The uniform distributionThe linear modelDuration = uniform r.v.Time at event = uniform r.v. Density
Uniform distribution Time at event follows uniform distribution (events are uniformly distributed during episode), implying a constant probability density for A t B Or: f(t) = 1/h for 0 t h and h = B - A
Uniform distribution Survival function is linear
Uniform distribution: expectancies Since d = 1/h when S(h) = 0
Uniform distribution: expectancies When S() =0
Uniform distribution: exposure a2+b2 = (a+b) (a-b) The exposure function associated with the linear survival function is quadratic.
Uniform distribution: exposure Relation between exposure function and survival function: where 0F(x,y) is the probability of an event in interval (x,y)
Uniform distribution: exposure Exposure (waiting time to event) in interval (0,h): L(h) = h - f h2 = h S(h) + f h2 = h [1- f h] Alternative specification: L(h) = h S(h) + E[X | 0X h] [1 - S(h)] Exposure during interval of length h, provided survival at beginning of interval:
Uniform distribution: rate Since f = 1/ : and If length of interval is one, rate is 2!!
Uniform distributionRelation between rate and probability Since xF(x,y) =1 - S(y)/S(x) :
Uniform distributionNumerical illustration Let density f = 0.10 Survival function: S(h) = 1 - f h => 1 - 0.10 h
1833=2026-0.5*386 0.0262= 48/1833 0.9738=1-0.0262
d=0.00218 =0.0022113=-ln(0.9738)/12
4. The exponential distributionDuration = exponential r.v.Time at event = exponential r.v.ln(duration) = uniform r.v. Intensity
Exponential distribution Time at event is exponentially distributed random variable, implying a constant intensity ()