Download
1 / 24
240 likes | 264 Vues
This lecture explores the distribution of CO2 in the ocean and the factors that control it. Topics include the role of rocks, gas exchange, upwelling/mixing, and the biological pump. The lecture also discusses the influence of nitrogen uptake and remineralization on alkalinity, as well as the composition of sinking particles and their impact on carbonate chemistry. Field data and models are used to understand the relationship between atmospheric and oceanic CO2 levels.

E N D
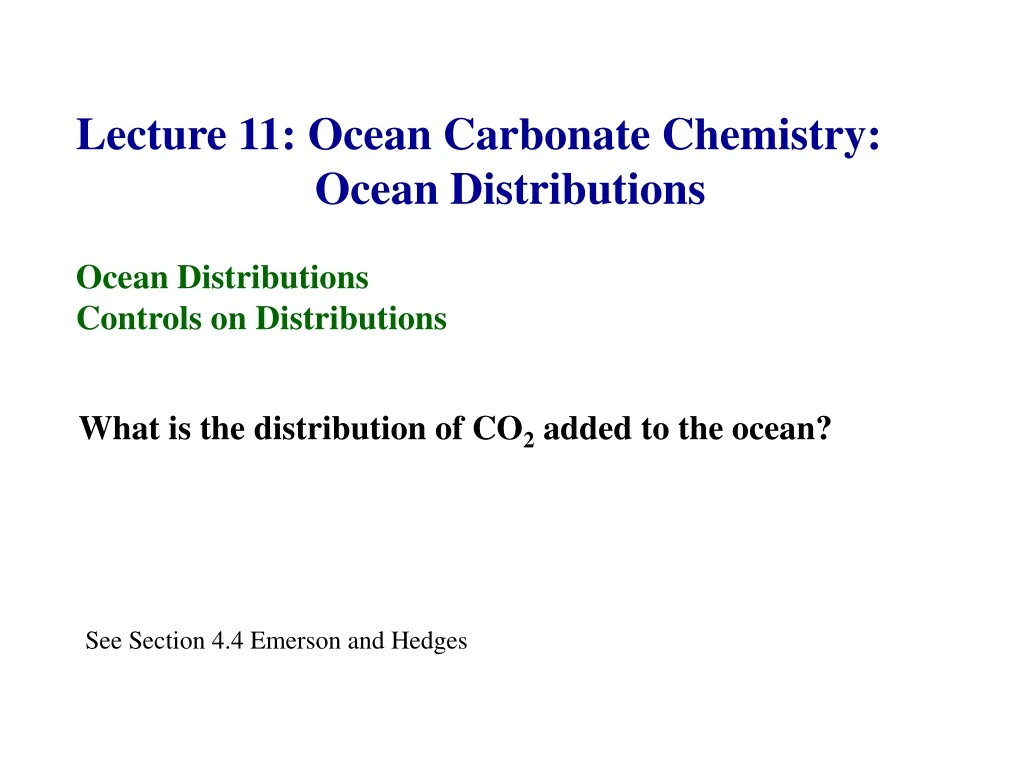
Lecture 11: Ocean Carbonate Chemistry: Ocean Distributions Ocean Distributions Controls on Distributions What is the distribution of CO2 added to the ocean? See Section 4.4 Emerson and Hedges
Sarmiento and Gruber (2002) Sinks for Anthropogenic Carbon Physics Today August 2002 30-36
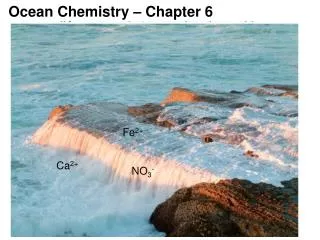
CO2 + rocks = HCO3- + clays CO2 River Flux Gas Exchange Atm Ocn CO2→ H2CO3→ HCO3- → CO32- Upwelling/ Mixing + H2O = CH2O + O2 + Ca2+ = CaCO3 CO2 BorgC BCaCO3 Biological Pump Controls: pH of ocean (controlled by DIC and Alk) Sediment diagenesis
Influences on pCO2Calculate from DIC and Alkalinity Ko: Solubility of CO2 (same as KH) K1, K2: Dissociation constants Function of Temperature, Salinity Depends on biology and gas exchange Depends on biology only Clues: Derive starting with: CO2(g) + CO32- = 2 HCO3- K = K1 KH K2-1 And use alk – DIC ~ CO32- and 2DIC – alk ~ HCO3-
Distribution of surface PCO2 Emerson and Hedges Plate 8
Ocean Distributions – versus depth, versus ocean Atlantic Pacific Points: 1. Uniform surface concentrations 2. Surface depletion - Deep enrichment 3. DIC < Alk 4. DDIC > DAlk See Key et al (2004) GBC Q?
Controls on Ocean Distributions A) Photosynthesis/Respiration Organic matter (approximated as CH2O for this example) is produced and consumed as follows: CH2O + O2 CO2 + H2O Then: CO2 + H2O H2CO3* H2CO3* H+ + HCO3- HCO3- H+ + CO32- As CO2 is produced during respiration we should observe: pH DIC Alk PCO2 CO2 is an acid The trends will be the opposite for photosynthesis. B) CaCO3 dissolution/precipitation CaCO3(s) Ca2+ + CO3 2- Also written as: CO32- is a base CaCO3(s) + CO2 + H2O Ca2+ + 2 HCO3- As CaCO3(s) dissolves, CO32- is added to solution. We should observe: pH DIC Alk PCO2 Summary: DIC is from both organic matter and CaCO3 Alk is only from CaCO3
Influence of Nitrogen Uptake/Remineralization on Alkalinity NO3- assimilation by phytoplankton 106 CO2 + 138 H2O + 16 NO3-→ (CH2O)106(NH3)16 + 16 OH- + 138 O2 NH4assimilation by phytoplankton 106 CO2 + 106 H2O + 16 NH4+→ (CH2O)106(NH3)16 + 16 H+ + 106 O2 NO3- uptake is balanced by OH- production Alk ↑ NH4+ uptake leads to H+ generation Alk ↓ Alk = HCO3- + 2 CO32- + OH- - H+ See Brewer and Goldman (1976) L&O Goldman and Brewer (1980) L&O Experimental Culture Studies
Ocean Distributions of, DIC, Alk, O2 and PO4 versus Depth and Ocean The main features are: 1. uniform surface values 2. increase with depth 3. Deep ocean values increase from the Atlantic to the Pacific 4. DIC < Alk DDIC > DAlk 5. Profile of pH is similar in shape to O2. 6. Profile of PCO2 (not shown) mirrors O2.
Carbonate ion (CO32-) and pH decrease from Atlantic to Pacific x 10-3mol kg-1 x 10⁻⁶ mol kg-1 Alk DIC CO32- pH Surface Water 2.300 1.950 2468.12 North Atlantic 2.350 2.190 1287.75 Deep Water Antarctic 2.390 2.280 1017.63 Deep Water North Pacific 2.420 2.370 727.46 Deep water S = 35 T = 25°C Deep Atlantic to Deep Pacific DAlk = 0.070 DDIC = 0.180 So DAlk/DDIC = 0.40 CO32- decreases from surface to deep Atlantic to deep Pacific. These CO32- are from CO2Sys. Can Approximate as CO32-≈ Alk - DIC Q? CO2Sys/CO2Calc
Composition of Sinking Particles and Predicted Changes Assume the following average elemental composition of marine particulate matter P N C Ca Si Soft Parts 1 15 105 0 0 Hard Parts 0 0 26 26 50 Composite 1 15 132 26 50 Implies Org C / CaCO3 ~ 105/26 ~4/1 The impact of this material dissolving CH2O + O2CO2 + H2O DDIC = 1 DAlk = 0 CaCO3 Ca2+ + CO32-DDIC = 1 DAlk = 2 1 mol CaCO3 4 mol orgC Composite DDIC 1 4 5 DCa 1 0 1 Dalk 2 0 2 Consequences: 1) DAlk/DDIC = 2/5 = 0.40 (DIC changes more than Alk) 2) Dalk – DDIC ~ DCO32- = 2 – 5 = -3 (CO3 2- decreases)
Ocean Alkalinity versus Total CO2 in the Ocean (Broecker and Peng, 1982)
DDIC/DAlk≈ 1.5/1 Work Backwards DAlk / DDIC ≈ 0.66 = 2/3 = 2 mol Org C / 1 mol CaCO3 Emerson and Hedges Color Plate Note: DICN and AlkN
What is composition of sinking particles? Data from annual sediment traps deployments 5 g POC g m-2 y-1 / 12 g mol-1 = 0.42 mol C m-2 y-1 40 g CaCO3 g m-2 y-1 / 105 g mol-1 = 0.38 mol C m-2 y-1 Org C / CaCO3 ~ 1.1 Q. What does this imply? From Klaas and Archer (2002) GBC
POC and CaCO3 Export Fluxes Based on Global Model results of Sarmiento et al (2992) GBC; Dunne et al (2007) GBC POC/CaCO3 = 9.6 / 0.52 = 18.5
Revelle Factor The Revelle buffer factor defines how much CO2 can be absorbed by homogeneous reaction with seawater. B = dPCO2/PCO2 / dDIC/ DIC B = CT / PCO2 (∂PCO2/∂CT)alk = CT (∂PCO2/∂H)alk PCO2 (∂CT/∂H)alk After substitution B ≈ CT / (H2CO3 + CO32-) For typical seawater with pH = 8, Alk = 10-2.7 and CT = 10-2.7 H2CO3 = 10-4.7 and CO32- = 10-3.8; then B = 11.2 Field data from GEOSECS Sundquist et al., Science (1979) dPCO2/PCO2 = B dDIC/DIC A value of 10 tells you that a change of 10% in atm CO2 is required to produce a 1% change in total CO2 content of seawater, By this mechanism the oceans can absorb about half of the increase in atmospheric CO2 B↑ as T↓ as CT↑
Revelle Factor Numerical Example (using CO2Sys) CO2 + CO32- = HCO3- 350ppm+ 10% = 385ppm CO2 Atm Ocn at constant alkalinity CO2→ H2CO3→ HCO3- → CO32- DIC 11.3 mM +1.2 (10.6%) 12.5 1640.5 mM +27.7 (1.7%) 1668.2 183.7 -11.1 (-6.0%) 174.2 1837 +17.9 (+0.97%) 1854.9 The total increase in DIC of +17.9 mM is mostly due to a big change in HCO3- (+27.7 mM) countering a decrease in CO32- (-11.1 mM). Most of the CO2 added to the ocean reacts with CO32- to make HCO3-. The final increase in H2CO3 is a small (+1.2 mM) portion of the total.
Effect of El Nino on ∆pCO2 fields High resolution pCO2 measurements in the Pacific since Eq. Pac-92 Eq Pac-92 process study PCO2sw Always greater than atmospheric Cosca et al. in press El Nino Index
Photosynthesis/respiration (shown as apparent oxygen utilization or AOU = O2,sat – O2,obs) and CaCO3 dissolution/precipitation vectors (from Park, 1969) CH2O + O2→ CO2 + H2O as O2↓ AOU ↑ CO2 ↑
Problem: DIC and Alk are capacity factors. pH and PCO2 are not. Define two water parcels with T, S, DIC and Alk Calc pH and PCO2 for these end members Mix them 50/50 Calculate T, S, DIC, Alk, pH and PCO2 of the mixture. Do all properties fall along a straight line?