Developing Icons Through Korean Mental Models: A Cultural Perspective on User Interface Design
240 likes | 360 Vues
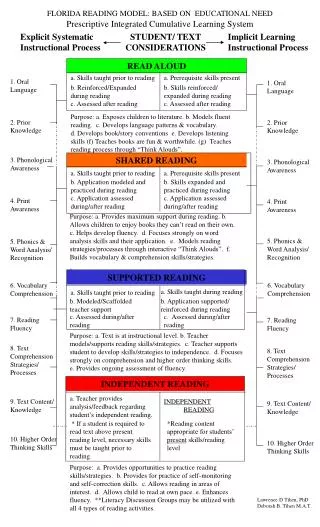
This study explores the significance of cultural context in icon design, focusing on Korean mental models. It investigates how cultural backgrounds shape user perceptions of icons and their meanings. Through experiments that involved selecting functions and collecting mental metaphors, the research identifies preferred icon representations among Korean users. The findings emphasize the necessity for localized icon designs that resonate with the users' cultural context for improved usability in GUIs. This work aims to bridge the gap in understanding cultural influences on icon design and highlights the need for further research in this area.

Developing Icons Through Korean Mental Models: A Cultural Perspective on User Interface Design
E N D
Presentation Transcript
Icon Development based on Korean Mental Model 전 윤 우
Contents 1. INTRODUCTION 1.1. Motivation 1.2. Aims of the study 1.2.1. Question of the study 1.2.2. Assumptions and limitations 1.3. Summary of introduction 3. EXPERIMENTS and RESULTS 3.1. Overview of the experiments 3.2. Experiment I: Building icons 3.2.1 Selecting functions 3.2.2 Collecting Mental Metaphors (Schemas) and building icons 3.3. Experiment II: Choosing the best icons 3.3.1. Methodology 3.3.2. Results: the best icons for each function 3.4. Evaluating Icons according to the icon- properties and users’ satisfactions 3.4.1. Methodology 3.4.2. Results: Analysis the result by MDS 3.5. Summary of results 4. DISCUSSION 5. CONCLUSIONS 2. RESEARCH BACKGROUND 2.1. Icon Interfaces 2.1.1. What are icons? 2.1.2. Mental model 2.1.3 Mental model and culture 2.1.4 Summary 2.2. Literature and technical research 2.2.1. Icon design processing 2.2.2. Usability test and evaluation test of icons 2.2.3. Analyzing the data (MDS)
Introduction 1.1. Motivation -1 • World: global marketplace (del Galdo and Neilsen, 1996) • Population stereotypes & miscommunications • Need to “Accustomed (localized) interfaces” • To Understand representations (icons) • Icons have matrix of meanings which depend on not only images themselves but also contexts and users like meaning of representation • R (Representation) means M (Meaning) in Context C (Searle, 1995) • Representations: color, icons, symbols, and characters, etc. Introduction (1/5) - Research and Background - Experiments and Results - Discussion - Conclusions
Introduction 1.1. Motivation -2 • Studies of cultural differences in user perception and icon design • Choong and Salvendy (1998) • American : alphanumeric icons • Chinese : pictorial icons • Ito and Nakakoji (1996) • different shapes of icons in word processors between Japanese and North American according to the cultural model • Piamonte et al. (2001) • Different understanding telecommunication symbols between European and American (a part of the projects – Asia, Europe, USA) Introduction (2/5) - Research and Background - Experiments and Results - Discussion - Conclusions
Introduction 1.1. Motivation –3 • Koreans have their own cultural background • Few studies of Korean cultural model and Korean mental model • Few studies of localized design-guideline of icon for Korean users
Introduction 1.3. Aims of the study • Questions of study • Were there original metaphors based on Korean own cultural backgrounds? • Were there Korean cognitive map to preferred icons through multidimensional scaling (MDS)? • Were local elements found through the test of preference? • Assumptions and limitations • Undergraduate and graduate students that are 20s • surveys and interview are performed through online • Selected icons which were used in experiments are based in MS word (97, 2000) and Hangul 97 Introduction (4/5) - Research and Background - Experiments and Results - Discussion - Conclusions
Introduction 1.4. Summary • Icons are the main element of the GUIs • Well-designed icons facilitate computer performance • Icons are representations effected by culture • Meaning of representations depends on the users’ mental processing and context • Recent studies are performed to aim of building users’ cultural model and evaluating the icons to fit the specific culture • More studies are needed according to Korean cultural background. Introduction (5/5) - Research and Background - Experiments and Results - Discussion - Conclusions
Research Background Icon interfaces • Icons • the objects (function or data) - metaphor images • associations or states through mapping the concept in the mind (Byrne, 1993; Gittins, 1986) • type, form, and color (Gittins, 1986) Introduction - Research and Background(1/5)- Experiments and Results - Discussion - Conclusions
Research Background Mental Model (Norman 1983; 1986; 1988; Young 1983) • There is no denying that culture influences human-product interaction. Culture is learned behavior consisting of thoughts, feelings, and actions(Hoft, 1996) Introduction - Research and Background(2/5)- Experiments and Results - Discussion - Conclusions
Research Background Mental model and culture • Cultural impact in the listening mode (Ito and Nakakoji, 1996) • Cultural difference on representations • Cultural bias or metaphors (Hoft, 1996) Introduction - Research and Background(3/5)- Experiments and Results - Discussion - Conclusions
Research Background Technical research • Horton (1994) • Iconic language • a vocabulary: collection of elementary symbols • a grammar : forming units of vocabularies of expression • Command = Action on Object by Method (Fig.) Introduction - Research and Background(4/5)- Experiments and Results - Discussion - Conclusions
Research Background Technical research • Icon-design process = system design process • Task analysis : interview, observation, questionnaire • Usability test : survey, experiment of performance • Evaluation : checklists, survey • Matsey (1996), Neilsen (1993), del Galdo (1998), etc. • Analyzing the data : Multidimensional Scaling (MDS) Introduction - Research and Background(5/5)- Experiments and Results - Discussion - Conclusions
Classification Method Property Research Background Basic KYST (Kruskal, Young, Sheperd, Togerson) Data mapping INDSCAL (Individual Difference SCALing) Data and personal difference analysis MDPREF (Multi Dimensional PREFerence) Data and subject mapping Applied PROFIT (PROperty FITting) Data and properties mapping PREFMAP (PREFerence MAP) Data, subjects, and preference mapping • MDS analysis
EXPERIMENTS and RESULTS • Process of experiment Development icons Experiments (Surveys) & Analysis (MDS) Introduction - Research and Background - Experiments and Results(1/6) - Discussion - Conclusions
Experiments and Results Experiment I: Building icons Ten Function Selecting • New document • Preview • Search • Font setting • Spelling check • Style • Table • Zoom in or out • Cut • Paste Introduction - Research and Background - Experiments and Results(2/6) - Discussion - Conclusions
Experiments and Results Experiment II: Choosing the best icons 40 women (age = 22.7±2.07 yrs.) 40 men (age = 23.4±2.71 yrs.) of Korea Univ . Introduction - Research and Background - Experiments and Results(3/6) - Discussion - Conclusions
Experiments and Results Experiment III: Evaluating Icons according to the icon-properties and users’ satisfactions 42 subjects (age = 24.0±2.50 yrs) Introduction - Research and Background - Experiments and Results(4/6) - Discussion - Conclusions
Experiments and Results Experiment III: (Additional) Evaluating Icons according to the icon-properties and users’ satisfactions Introduction - Research and Background - Experiments and Results(5/6) - Discussion - Conclusions
Experiments and Results • Summary • New icons based on Korean users’ mental model were designed. • The best icons of each function were selected according to preference. • Icons were evaluated through the questionnaires which consisted of questions of properties and satisfaction. • Through MDS analysis, the icon, properties and satisfaction were mapped on two dimensions. Also, the results were well illustrated the relation among icon, properties and satisfaction. Introduction - Research and Background - Experiments and Results(6/6) - Discussion - Conclusions
Discussion • New icons developed based on Korean • Spell check • Paste • Style • Simple icons • new document • font setting Introduction - Research and Background - Experiments and Results- Discussion (1/3) - Conclusions
Discussion • MDS Analysis • Koreans prefer the complex representation of icon • Subjects were satisfied with the real object to be expressed as icons • This condition is opposite from icon’s characteristic, which is considered significant by icon guideline (Horton, 1994) • Preference • Korean users prefer the iconic representation added more information about function with real object Introduction - Research and Background - Experiments and Results- Discussion (2/3) - Conclusions
Discussion • a case study • It had been tried to discover the cultural differences of iconic design among Asian countries, China, Japan, and Korea • Although the schemata of functions about mailbox were different shape and color to express own cultural background, Chinese and Japanese have chosen the globalized icon • Established icons from B product (made in Korea) are more preferred than icons from A product • Choong and Salvendy (1993) Introduction - Research and Background - Experiments and Results- Discussion (3/3) - Conclusions
Conclusions • the development of icons based on cultural model • spell check, zoom in/out, paste, and search • the guideline for development of icons • Complex activity of iconic representation, Group I is able to understand the icon and to learn the icon easily • Concrete iconic representation, Group III has designed icon based on the real object in real world with pictographical elements (color) • Simple representation of icon, Group IV gives the user bad satisfaction of icon represented (well-known icons only) • Abstract iconic representation, Group V is not useful • Specialty of iconic representation is able to help to learn the icon : However, the elements to inform special facts have to be used as real object Introduction - Research and Background - Experiments and Results - Discussion - Conclusions