world development report 2004
world development report 2004. Making Services Work for Poor People. Flagship Course on Governance & Anticorruption Washington DC, December 2, 2003 . Messages. Services are failing poor people. But they can work. How? By empowering poor people to

world development report 2004
E N D
Presentation Transcript
world development report 2004 Making Services Work for Poor People Flagship Course on Governance & Anticorruption Washington DC, December 2, 2003
Messages • Services are failing poor people. • But they can work. How? • By empowering poor people to • Monitor and discipline service providers • Raise their voice in policymaking • By strengthening incentives for service providers to serve the poor
Why focus on human development outcomes? Millennium Development Goals: global aggregates Eradicate poverty and hunger Universal primary education Source: www.developmentgoals.org
Millennium Development Goals: global aggregates Promote gender equality Reduce child mortality Source: www.developmentgoals.org
Outcomes are worse for poor peopleInfant and child deaths per 1000 live births Source: Analysis of Demographic and Health Survey data
Outcomes are worse for poor peoplePercent aged 15 to 19 completing each grade or higher Source: Analysis of Demographic and Health Survey data
Growth is not enough Sources: World Bank 2003a, Devarajan 2002. Notes: Average annual growth rates of GDP per capita assumed are: EAP 5.4; ECA 3.6; LAC 1.8; MENA 1.4; SA 3.8; AFR 1.2. Elasticity assumed between growth and poverty is –1.5; primary completion is 0.62; under-5 mortality is –0.48.
Increasing public spending is not enough * Percent deviation from rate predicted by GDP per capita Source: Spending and GDP from World Development Indicators database. Under-5 mortality from Unicef 2002
Increasing public spending is not enough * Percent deviation from rate predicted by GDP per capita Source: Spending and GDP from World Development Indicators database. School completion from Bruns, Mingat and Rakatomalala 2003
Similar changes in public spending can be associated with vastly different changes in outcomes Sources: Spending data from World Development Indicators database. School completion from Bruns, Mingat and Rakatomalala 2003
and vastly different changes in spending can be associated with similar changes in outcomes. Sources: Spending data for 1990s from World Development Indicators database. Child mortality data from Unicef 2002. Other data from World Bank staff
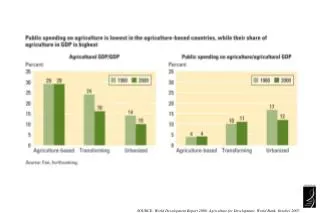
How are services failing poor people? • Public spending usually benefits the rich, not the poor
Expenditure incidence Health Education Source: Filmer 2003b
How are services failing poor people? • Public spending benefits the rich more than the poor • Money fails to reach frontline service providers • In Uganda, only 13 percent of non-wage recurrent spending on primary education reached primary schools
How are services failing poor people? • Public spending benefits the rich more than the poor • Money fails to reach frontline service providers • Service quality is low for poor people
Examples of low service quality • India: Absenteeism rates for teachers in government primary schools: 50 percent • Bangladesh: Absenteeism rates for doctors in primary health care centers: 74 percent • Zimbabwe: “nurses hit mothers during delivery” • Guinea: 70 percent government drugs disappeared • India: Delhi & Chennai get 4 to 6 hours of water per day, Hyderabad gets 1.5 hours every other day
But services can work • Infant mortality and malnutrition reduced in Ceará, Brazil • Citywide services in Johannesburg, South Africa reformed • Municipal services improved in Bangalore, India • Rural electricity cooperatives increased access to power in Bangladesh • More money reached primary schools in Uganda
What contributes to an effective classroom or health clinic? • For a service transaction to be successful, we need a frontline providerwho: • is capable • has access to adequate resources & inputs • is motivated to pursue goals that can be monitored
So, spend more money to hire and train more teachers? • But governments spend a lot on teachers’ salaries • 16 out of 18 sub-Saharan African countries spent more than the recommended 66% of recurrent education spending on teacher salaries, some more than 90% • It’s obvious this crowds out other inputs, yet governments keep spending on salary budgets • So problem is not these proximate determinants, but with institutional context that generates and sustains these decisions
One way of looking at the problem of a motivated provider • Reducing teacher absenteeism from, say, 12% to 7% is a matter of money and technical solutions such as training: it’s a managerial problem • Reducing absenteeism 70% to 7% is not a matter of money and technical solutions, it’s an institutional problem
What, then, is the right question to ask? • What institutional conditions support the emergence of good frontline providers and services that work for poor people? • The answer: Services work for poor people when they involve institutional relationships in which key players in service delivery are accountable to each other
Accountability seems key to service delivery… • If accountability is strong or can be strengthened, services may be improved by spending more on: • building more schools and clinics • training more teachers and health workers • designing better curricula & drug procurement schemes • building bigger infrastructure networks … • But if accountability remains weak, addressing the proximate determinants of success will not work
A framework of relationships of accountability Poor people Providers
A framework of relationships of accountability Policymakers Poor people Providers
A framework of relationships of accountability Policymakers Voice Poor people Providers
Mexico’s PRONASOL, 1989-94 • Large social assistance program (1.2 percent of GDP) • Water, sanitation, electricity and education construction to poor communities • Limited poverty impact • Reduced poverty by 3 percent • Even an untargeted, uniform per capita transfer would have reduced poverty by 13 percent
PRONASOL expenditures according to party in municipal government Source: Estevez, Magaloni and Diaz-Cayeros 2002
A framework of relationships of accountability Policymakers Compact Poor people Providers
Policymaker-provider:Contracting NGOs in Cambodia • Contracted out: NGO managed & could hire, fire, & transfer staff, set wages, procure drugs • Contracted in: NGO managed and could transfer but not hire and fire staff • Control group: Services run by government 12 districts randomly assigned to each category
Contracting for Outcomes: health services in Cambodia Use of facilities by poor people ill in previous month Source: Bhushan, Keller and Schwartz 2002
A framework of relationships of accountability Policymakers Poor people Providers Client power
Keeping girls in secondary school in Bangladesh: choice • Girls to receive scholarship deposited to bank account set up in their name if • Attend school regularly • Maintain passing grade • Stay unmarried • Schools receive grants based on number of girls enrolled
EDUCO program in El Salvador: participation • Parents’ associations contract with Education Ministry to deliver primary education • Associations have authority to: • visit schools on regular basis • hire and fire teachers
EDUCO promoted parental involvement… …which boosts student performance Source: Adapted from Jimenez and Sawada 1999
National policymakers Local policymakers Poor people Providers Accountability and decentralized service delivery
What not to do • Leave it to the private sector • Simply increase public spending • Apply technocratic solutions
What is to be done? • Expand information • Tailor service delivery arrangements to service characteristics and country circumstances
Politics matters for service delivery • Lack of information among voters about politician performance • Social, cultural, & ideological polarization that leads to identity-based voting • Lack of credibility of political promises • Politics dominated by clientelism, political patrons providing “private” goods to clients
Some puzzles on politics • Why do politicians who depend on political support of poor people not deliver basic services to them? • Why are voters not able to provide stronger incentives for politicians & service providers to deliver better service outcomes? • What is the impact of political market failures on basic service outcomes for poor people?
Donors and service delivery Policymakers Project implementation units Global funds Poor people Providers Community driven development