Download

1 / 24
240 likes | 258 Vues
Analysis of firm heterogeneity in EU countries and its impact on trade implications based on new-new trade theory with a focus on productivity, export elasticity, and trade patterns.

E N D
Paloma Lopez-Garcia DG-Economics Claire Giordano Banca d’Italia Firm heterogeneity and trade in EU countries:a cross-country analysis First CompNet data user conference Paris, 8-9 October 2019 Disclaimer: This presentation should not be reported as representing the views of the ECB. The views expressed are mine and do not necessarily reflect those of the ECB
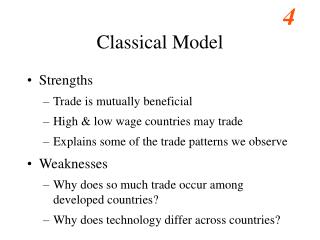
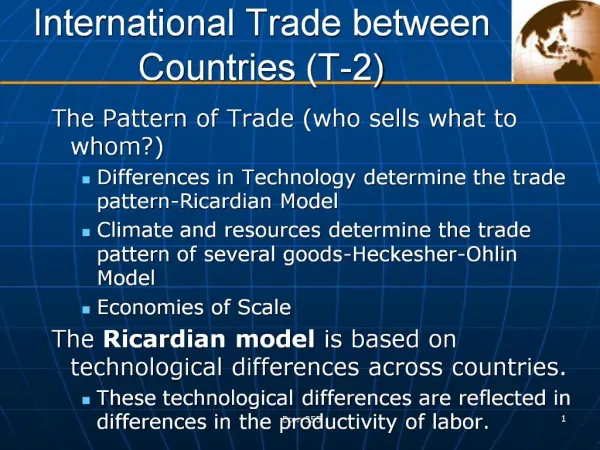
In the neoclassical trade models, countries specialise in the industries where they have a comparative advantage • Ricardo (1817); Heckscher(1919); Ohlin (1933); Samuelson (1948) “New trade” theory incorporated the empirical feature that trade across countries also occurs within the same industry • Krugman (1980); Helpman and Krugman (1985) “Standard” trade theory: countries, rather than firms, compete Until the 1990s, the standard trade theory assumed that firms were homogeneous within each economy
Large implications for our understanding of trade • Only few (ex-ante) large and very productive firms engage in trade; or in other words, most firms do not export/import • Trade can increase aggregate productivity growth: • By increasing within-firm productivity growth: powerful channel for technology transfer • By improving the allocation of resources across firms • Most exporters are also importers, which means that a REER depreciation does not have to be positive for exports New-new trade theory: only few firms can compete internationally New-new trade theory (Bernard and Jensen, Ottaviano, Melitz) puts firm heterogeneity at the centre: only few, special, firms export
We test the implications of the new-new trade theory on a dataset with harmonised data covering 14 EU countries (CompNet) Particular emphasis on the differences between the “new” and the “old” EU countries (countries that joined the EU by 1995) • Countries: BE, CZ, DK, FI, FR, IT, EE, HU, LT, PL, PT, RO, SK and SI • Data from 2002 to 2013 • 23 manufacturing industries Paper structured around 7 implications, clustered in 2 topics: • The two-way link between trade and productivity • The impact of firm heterogeneity on export elasticity to REER fluctuations Contribution of this paper: testing the implications Implications of the new-new trade theory have been so far tested empirically on individual countries, using different datasets
Overview 1 Motivation 2 Data 2 The two-way link between trade and productivity 3 Firm heterogeneity and export elasticity to REER fluctuations 4 Some conclusions
Data coverage: 4th and 5th vintage of CompNet data Data for 14 EU countries (8 new EU and 6 old EU), 23 manufacturing industries and 12 years (unbalanced) Notes: (1) Coverage is computed over the period 2004‑2007, with the exception of Portugal (2006‑2007). Data of the population of firms with at least 1 employee come from the OECD Structural Business Statistics repository; (2) France, Poland and Slovakia provide information only for firms with 20 employees or more. The coverage is computed over the population of firms with 20 employees or more; (3) Coverage of the whole economy (not only private firm sector) is computed for 2005, with the exception of Portugal, for which 2006 is used instead. Eurostat data comes from National Accounts: series nama_gdp_c and nama_aux_pem, respectively.
Overview 1 Motivation 2 Data 2 The two-way link between trade and productivity 3 Firm heterogeneity and export elasticity to REER fluctuations 4 Some conclusions
Implication #1: Only the more productive firms export Seminal work of Melitz (2003): fixed and variable costs of exporting imply that only the most productive firms export in a given sector Performance premia of new exporters vis-à-vis non-exporting firms in the same 2-digit sector • Pooled regression of log performance on dummy=1 if new exporter, firm controls and rich FE (country*year, sector), robust • Average performance of new exporters is significantly larger than that of non-exporting firms in same country-sector-year; • Premia is significantly larger in NEW EU countries • When premia calculated country-by-country, wide country differences with productivity premia up to 50% (see here) Notes: Panel of 23 industries over the period 2002-2013 Robust standard errors.
Implication #2: Granularity of exports Given skewed productivity distributions, only few firms can pay trade costs: exports are very concentrated in few players Correlation of export growth of top 10 exporters and aggregate export growth Annual growth rate Concentration of country exports in top 5 or 10 exporters Share of total exports Sources: CompNet, 4th and 5th vintage. Notes: Share of total exports of top exporters, defined on the basis of their value of exports. Sources: CompNet, 4th and 5th vintage, and Eurostat. Notes: Annual nominal growth of exports of goods, %. Controlling by sector of activity
Implication #3: Trade increases firm performance Channels: skills upgrading, learning-by-exporting, technology transfer Performance of manufacturing incumbent exporters (importers) relative to new exporters (non-exporters) in the same c-s-t Trade, and in particular GVCs, are powerful channels for technology transfer TFP growth rates Sources: Chiacchio et al. (2018) based on CompNet and WIOD (2016) data. Notes: The GVC frontier is the weighted average of TFP growth of the most productive firms in non-CEE EU countries, with weights based on the share of imported intermediates of each CEE country-sector pair from each non-CEE EU country. The CEE EU countries are CZ, EE, HR, LV, LT, HU, PL, RO, SK, SI. The non-CEE EU countries are BE, DK, DE, SP, FR, IT, PT, FI. Sources: Authors’ calculations based on CompNet data. Notes: Panel of 23 industries over the period 2002-2013, with country*time and sector FE. Continuing exporters defined as exporting for at least 3 consecutive years, importers defined as importing at t. Robust standard errors, clustered at the cs.
Implication #4: Trade can foster a better allocation of resources An increase in potential markets due to lower trade costs can lead to an expansion (contraction) of market share of (un)productive firms Trade and sectoral allocative efficiency • Allocative efficiency: within-sector covariance between firm’s TFP and market share; • Sector openness to trade: share of exporting firms (or total export value) in the sector; • Allocation of resources is more efficient in sectors more open to trade • After controlling for c*y and s FE • No significance difference between NEW and OLD EU countries – here results Sources: 5th vintage of CompNet data. Notes: The “OP gap” is computed as the covariance between firm real value added and TFP in the manufacturing sector. The higher the covariance, the more efficient the allocation of productive resources across firms..
Overview 1 Motivation 2 Data 2 The two-way link between trade and productivity 3 Firm heterogeneity and export elasticity to REER fluctuations 4 Some conclusions
Implication #5: Export elasticity varies widely across sectors Aggregation bias results in very low/insignificant export elasticities when using macro data: puzzling and with implications Sources: 5th vintage of CompNet data. Notes: Sector-specific mean-group estimation of sector-specific regressions with country and time FE. Robust standard errors reported.
Implication #6: Heterogeneous reaction of exports to REER changes Heterogeneous reaction of the intensive margin of exports to changes in REER depending on market concentration and GVCs • We regress the change in exports of continuing firms on: • Sector foreign demand (from Berthou et al. 2017); • Change in sector REER-PPI (from Dozovic 2017) ; • The interaction of REER with sector concentration and GVC participation • In more concentrated sectors and in sectors with higher GVC participation, the elasticity of exports to REER changes is LOWER • No difference across EU regions
Implication #7: Heterogeneous reaction of exports to REER changes REER fluctuations can also affect aggregate exports through the extensive margin: new exporters can jump into international mkt • This will be particularly the case if large mass of firms close to the productivity threshold • We approximate that “mass” with the ratio of TFP of non-exporting firms to new exporters in the same country, sector and year • The closer to 1, the larger the expected impact of a REER depreciation on the extensive margin • We find it is the case; No difference across EU regions
Overview 1 Motivation 2 Data 2 The two-way link between trade and productivity 3 Firm heterogeneity and export elasticity to REER fluctuations 4 Some conclusions
Wrapping up The inclusion of firm heterogeneity in trade theory has revolutionised the field • We can now understand earlier “paradoxes”… • Lack of significance of macro-estimated export elasticities (Kaldor 1978) • Increase in Spanish export market share during the pre-crisis period despite booming average ULC – although not those of exporting firms (Antras 2011) • …and design better policies • Importance of scale to overcome fixed trade costs • Importance of cross-border production chains for aggregate growth • Large impact of protectionism policies, above all in catching-up economies relying on technology adoption • Depreciation can be useful if low participation in GVCs, but might be futile otherwise
Country-by-country performance premia of new exporters Performance premia of new exporters vis-à-vis non-exporting firms in the same 2-digit sector, country by country regressions
Implication #2: Granularity of exports – sector details Share of manufacturing exports sold by top exporting firms and median firm size in the sector Average percentage shares in 2002-2013 Concentration of country exports in top 5 or 10 exporters Share of total exports Sources: CompNet, 4th and 5th vintage Notes: Export shares of the top ten exporting firms in each manufacturing sector and median number of employees per company in a given sector. Sectors: 10. Food; 11. Beverages; 13. Textiles; 14. Wearing apparel; 15. Leather and related products; 16. Wood and cork; 17. Article products; 18. Printing and media; 20. Chemicals; 21. Pharmaceuticals; 22. Rubber and plastic; 23. Other non-metallic mineral; 24. Basic metals; 25. Fabricated metal; 26. Computer and electronics; 27. Electrical equipment; 28. Machinery and equipment; 29. Motor vehicles; 30. Other transports; 31. Furniture; 32. Other manufacturing; 33. Repair and installation of machinery. Sectors marked in red are sectors with the two highest (sectors 30 and 21) and lowest (sectors 25 and 28) average percentage shares of manufacturing exports sold by top exporting firms Sources: CompNet, 4th and 5th vintage. Notes: Ratio of the size in terms of employees of exporters in a given 2-digit manufacturing sector in a given size decile to the EU average, normalised to 1. p_10, p_50 and p_90 refer to a exporters in the 10th, 50th and 90th decile of the size distribution, respectively.
Implication #4: Trade can foster a better allocation of resources No significant difference across EU regions Trade and sectoral allocative efficiency Sources: 5th vintage of CompNet data. Notes: The “OP gap” is computed as the covariance between firm real value added and TFP in the manufacturing sector. The higher the covariance, the more efficient the allocation of productive resources across firms..
Implication #6: Heterogeneous reaction of exports to REER changes No differences between NEW and OLD EU countries
Implication #7: Heterogeneous reaction of exports to REER changes No difference across EU regions
Implication #8: trade costs depends also on finance and institutions We approximate fixed trade costs with the (time-varying, country-specific) productivity premium of new exporters • We regress that premia against a number of tariff, financial access and quality of institution indicators (sourced from Fraser Institute) CompNet approach to competitiveness