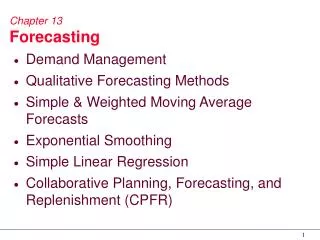
Section 13 Developing a Forecasting Program
Section 13 Developing a Forecasting Program. Understanding Users’ Needs Understanding the Processes that Control Air Quality Choosing Forecasting Tools Data Types, Sources, and Issues Forecasting Protocol Forecast Verification. Understanding Users’ Needs. Success depends on forecast

Section 13 Developing a Forecasting Program
E N D
Presentation Transcript
Section 13Developing a Forecasting Program Understanding Users’ Needs Understanding the Processes that Control Air Quality Choosing Forecasting Tools Data Types, Sources, and Issues Forecasting Protocol Forecast Verification
Understanding Users’ Needs • Success depends on forecast • Accuracy • Meeting the users’ needs • Three main uses (Section 5) • Protect public health • Operate emissions reduction programs • Conduct special monitoring • Consider these issues • Size of forecast domain • Population affected • Pollutants to forecast • Industries to be controlled • Smog transport • Process • Gather stakeholders • List of questions (next three slides) Section 13 – Developing a Forecasting Program
Understanding Users’ Needs – Forecast Specification Questions (1 of 3) Who will use the forecast? • For how many months are forecasts needed? • Certain season (summer and fall) • What periods should a forecast cover? • Current and next day • 1-5 days • Are multi-day forecasts needed for weekend/holiday periods? Section 13 – Developing a Forecasting Program
Understanding Users’ Needs – Forecast Specification Questions (2 of 3) • What are the accuracy requirements? • Define target first • Make sure it is reasonable • What area do the air quality forecasts cover? • Regional maximum • Sub-regions or monitoring sites • Are written forecast discussions of predicted weather and air quality conditions needed? Section 13 – Developing a Forecasting Program
Understanding Users’ Needs – Forecast Specification Questions (3 of 3) • How should forecasts be disseminated? • E-mail, fax, phone • Web site • When should forecasts be issued to meet deadlines? • Should forecasts be re-issued? If so, under what conditions? • Should forecasts be made for specific concentrations or concentration ranges (e.g., AQI or API categories)? • How should missed forecasts be handled? Section 13 – Developing a Forecasting Program
Understanding the Processes that Control Air Quality (1 of 5) • Literature reviews • Data analysis (exploring data to answer questions) • Simple statistical analyses • Field studies with subsequent research • Computer modeling • Categories of analysis • Temporal distribution of air quality • Spatial distribution of air quality • Monitoring issues • Meteorological and air quality processes • Many more questions in U.S. EPA Guidelines for developing an air quality forecasting program (U.S. Environmental Protection Agency, 2003) Section 13 – Developing a Forecasting Program
Understanding the Processes that Control Air Quality (2 of 5) Example: Temporal distribution of air quality questionFor how many consecutive days do high ozone or PM2.5 episodes typically last? Section 13 – Developing a Forecasting Program
Understanding the Processes that Control Air Quality (3 of 5) Example: Spatial distribution of air quality question GTT – please provide a figure showing different spatial patterns of air quality during different seasons Section 13 – Developing a Forecasting Program
Understanding the Processes that Control Air Quality (4 of 5) Example: Monitoring issues question What are the different PM2.5 monitoring methods and how do they compare to one another? GTT - Need a figure(s) showing comparisons of different monitoring types and how they compare Section 13 – Developing a Forecasting Program
Understanding the Processes that Control Air Quality (5 of 5) Example: Meteorological and air quality process question Does surface or aloft transport of pollutants from other areas contribute to air quality in the forecast area? Ryan et al., 1998 Section 13 – Developing a Forecasting Program
Choosing Forecasting Tools (1 of 3) • General guidelines • Start with simple tools and add complex tools later • Consensus approach to forecasting works best • Establish a reliable product (not necessarily the most accurate) • Persistence, time series, and climatology tools will never identify a significant change in air quality • Regression, CART, and neural networks require time to develop and validate, but are usually more accurate than persistence • Photochemical modeling can be more accurate, but requires significant resources • Resource considerations • Development costs vs. operational costs • Time needed to forecast Section 13 – Developing a Forecasting Program
Choosing Forecasting Tools (2 of 3) • Severity of problem • Seasons, number of pollutants to forecast • Limited problem – use simple methods • Severe problem – use many forecasting methods • Consensus forecasting works best • More tools provide a better forecast • Cumulative knowledge of all forecasting tools is greater than using a single tool • As the pollution problem becomes more complex, no single forecasting tool can reliably predict all relevant factors Section 13 – Developing a Forecasting Program
Choosing Forecasting Tools (3 of 3) • Experience • Some forecasting tools require extensive experience • Working with a local university to develop tools can be beneficial • No tool can replace forecaster experience Section 13 – Developing a Forecasting Program
Data Types, Sources, and Issues(1 of 6) • Basic data requirements for air quality forecasting • Operational forecasting • Surface and upper-air meteorological observations • Surface air quality observations • Meteorological model forecasts • Satellite images (visible and infrared) • Historical case study analysis and tool development • Five years of data • Surface and upper-air meteorological observations • Surface air quality observations • Satellite images (visible and infrared) Section 13 – Developing a Forecasting Program
Data Types, Sources, and Issues(2 of 6) • Operational data access issues • Cost • Reliability • Back up data sources • Quality control Section 13 – Developing a Forecasting Program
Data Types, Sources, and Issues(3 of 6) Example: Sample Size • At least five years of data • Be aware of changes in emissions (fuel changes, new sources) Number of days exceeding the federal 8-hr ozone standard of 0.085 ppm in Sacramento, California. The solid line indicates a five-year moving average. (U.S. EPA, 2003) Section 13 – Developing a Forecasting Program
Data Types, Sources, and Issues(4 of 6) • Data Issues: Monitoring Network • Does the monitoring network capture the peak concentrations? • Has the monitoring network changed? • What types of monitors exist? • Street • Neighborhood • Urban • Background • Downwind • Rural Section 13 – Developing a Forecasting Program
Los Angeles, California Atlanta, Georgia Minneapolis, Minnesota Data Types, Sources, and Issues(5 of 6) Example: Monitoring Networks Section 13 – Developing a Forecasting Program
Data Types, Sources, and Issues(6 of 6) • Miscellaneous data issues • Expect several different formats (significant effort is spent assembling a data set) • Seek to standardize units (e.g., ppm or μg/m3, m/s or kts) • Carefully examine time standards and conventions • Time zones (UTC, LST, LDT) • Validation times for model data • Time stamp (begin hour, end hour, middle) • Continually examine data quality • Outliers • Calibrations • Biases Section 13 – Developing a Forecasting Program
Forecasting Protocol (1 of 3) • Forecasting protocol • Written document • Describes the daily operating procedures • Helps guide personnel through the forecasting process • Ensures that all activities are performed on time (reduces last minute decisions) • Maintains consistency among forecasters Section 13 – Developing a Forecasting Program
Forecasting Protocol (2 of 3) • Components of a forecasting protocol • Descriptions of the meteorological conditions that produce high pollution concentrations in an area • A schedule of daily tasks and personnel responsibilities • Steps to take to arrive at a forecast • Forms and worksheets for documenting data, forecast information, forecast rationale, and comments that forecasters can analyze and evaluate later Section 13 – Developing a Forecasting Program
Forecasting Protocol (3 of 3) • Components of a forecasting protocol • Phone and fax numbers and e-mail addresses of key personnel • Names, fax and phone numbers, and e-mail addresses of forecast recipients • Troubleshooting and backup procedures for the key components necessary to produce and issue the pollutant forecasts such as: backup forecasters, redundant data acquisition methods, and forecast dissemination Section 13 – Developing a Forecasting Program
Forecast Verification Overview • Comparing forecasts to actual observations to quantify success of forecasting program • Topics • Why verify air quality forecasts? • Schedule • Types of verification: categorical and discrete • Contingency table and examples • Performance targets • Forecast retrospective Section 13 – Developing a Forecasting Program
Forecast Verification • Why verify air quality forecasts? • Quantify the performance of forecasters and/or the forecast program • Identify trends in forecast performance over time • Quantify improvements from new (or changes in) forecasting methods/tools • Compare verification statistics to those from other agencies that forecast air pollution • Demonstrate the performance of forecasts to program participants, stakeholders, and the media Section 13 – Developing a Forecasting Program
Forecast Verification Schedule (1 of 4) • Daily verification • Can identify systematic problems • Can identify mistaken analysis of events • Can identify problems with data • Provides opportunity for mid-season procedure corrections • Seasonal verification • Identifies if model/methodology is appropriate • Benchmarks performance of models and forecasters Section 13 – Developing a Forecasting Program
Courtesy of Doc Taylor, NYDEC Forecast Verification Schedule (2 of 4) • Daily • Each morning, review prior day observations and forecasts. • Keep a log book of performance and problems encountered. Section 13 – Developing a Forecasting Program
Forecast Verification Schedule (3 of 4) • Daily (continued) • If forecasts were significantly missed (off by more than 30%) • examine what caused the missed forecast • write a forecast retrospective • Monthly and annually • Use statistical measures • Compare to other regions Forecast Retrospective 1. Summary of event Provide a brief synopsis of what happened. 2. Forecast rationale Explain the steps and thought processes used to make the forecast. 3. Actual weather and air quality conditions Discuss all aspects of the weather that occurred. Use weather maps, satellite images, observations. Review the relevant air quality conditions. 4. Revision to forecasting guidelines Recommend relevant changes to forecasting procedures. Section 13 – Developing a Forecasting Program
Forecast Verification Schedule(4 of 4) Example: Forecast Retrospective • Missed several forecasts by 10 to 20 ppb • Analyzed forecasted vs. observed weather variables Analysis of forecasted and observed ozone and meteorological conditions for September 19–25, 2001, in Sacramento, California, USA Section 13 – Developing a Forecasting Program
Very Unhealthy Unhealthy Unhealthy for Sensitive Groups Moderate Good Forecast Verification Types(1 of 5) • Categorical • Compare observed and forecasted air quality categories • Focus on simple performance measures • Evaluate two-category threshold forecasting • Good–Moderate • Unhealthy • Evaluate five category forecasts • Evaluate next-day (24-hr) forecast • Discrete • Compare observed and forecasted concentrations • Quantifies the uncertainty in each forecast Section 13 – Developing a Forecasting Program
Forecast Verification Types (2 of 5) • Categorical: Compare observed and forecasted air quality categories • Percent correct (PC) – Percent of forecasts that correctly predicted the categories • False alarm (FA) – Percent of times a forecast of the category did not actually occur • Probability of detection (POD) – Percent of target category days correctly predicted Section 13 – Developing a Forecasting Program
Forecast Verification Types (3 of 5) Categorical Statistical Measures: Examples Ozone (ppb) Forecasted Unhealthy No Yes Totals Observed Unhealthy Totals Yes No Percent Correct = (10+3)/18 = 72% False Alarm = 2/5 = 40% Probability of Detection = 3/6 = 50% = Unhealthy = Moderate = Good Section 13 – Developing a Forecasting Program
Forecast Verification Types (4 of 5) • Discrete: Compare observed and forecasted concentrations • Accuracy – Average closeness between the forecasted and observed concentrations • Bias – On average, the tendency to over or underpredict the concentrations Section 13 – Developing a Forecasting Program
Accuracy = = 11.4 ppb Bias = = -1.05 Forecast Verification Types (5 of 5) Discrete Ozone (ppb) • Discussion • On average, each forecast has an 11-ppb error or is accurate to within 11 ppb • Forecasts are biased low by 1 ppb Section 13 – Developing a Forecasting Program
Forecast Verification – Categorical(1 of 3) (n1 + n6 + n11 + n16) Accuracy = 100* ------------------------------------ [ sum(n1…n16) ] (n9 + n10 + n13 + n14 + n15) False Alarm = 100* -------------------------------------------------------------------- (n9 + n10 + n11 + n12 + n13 + n14 + n15 + n16) (n11 + n12 + n15 + n16) Probability of Detection = 100* -------------------------------------------------------------------- (n3 + n7 + n11 + n15 + n4 + n8 + n12 + n16) Section 13 – Developing a Forecasting Program
Forecast Verification – Categorical(2 of 3) Observed Unhealthy Good Moderate Unhealthy f o r SG Good 99 2 1 0 Predicted Moderate 15 26 2 2 Unhealthy f o r S G 3 10 10 3 Unhealthy 0 0 6 3 Percent Correct (accuracy) = 76% False Alarm = 37% Probability of Detection = 84% Section 13 – Developing a Forecasting Program
Observed Unhealthy Good Moderate Unhealthy f o r SG Good 127 7 2 0 Predicted Moderate 12 55 4 0 Unhealthy f o r S G 0 2 0 0 0 Unhealthy 0 0 0 Forecast Verification – Categorical(3 of 3) Percent Correct (accuracy) = 87% False Alarm = 100% Probability of Detection = 0% Section 13 – Developing a Forecasting Program
Forecast Verification – Other Measures • Critical Success Index (CSI) • Examines only high forecasts or observations • Not affected by a large number of correctly forecasted, low-pollution events • Skill scores • Compares forecast skill to reference • Climatology or persistence used as reference • Correlation • Measures relationship between forecasts and observations • Identifies if two sets of data change together • Full discussion is in the Guidelines for Developing an AQ Forecasting Program document (U.S. Environmental Protection Agency, 2003) Section 13 – Developing a Forecasting Program
Forecast Verification – Performance Targets (1 of 2) • Forecast should be unbiased – equal numbers of over and underpredictions • Occasional big misses are expected – review for cause of error • Repeated bias in one direction (high or low) suggests a systematic problem • Agency policy may impact the bias • Example: protect public health – better to forecast high (higher bias) Section 13 – Developing a Forecasting Program
Forecast Verification – Performance Targets (2 of 2) • Forecaster error should be differentiated from prediction-model error • Categorical statistics • Percent Correct is threshold dependent • Start with 50% - 67% • Optimally 80% - 90% • Probability of Detection: 60% - 70% • False Alarm: 30% - 40% • Discrete statistics • The error should be approximately 10% of the maximum observed concentration • The statistics may be misleading if the threshold is set too high or too low • Changes in forecast performance suggest changes in the air quality trend and it may be time to develop new tools Section 13 – Developing a Forecasting Program
Summary (1 of 2) • Understanding users’ needs • Size of forecast domain • Population affected • Pollutants to forecast • Industries to be controlled • Smog transport • Understanding the processes that control air quality • Literature reviews • Data analysis • Choosing forecasting tools • Start with simple methods • Use more than one method • Forecaster experience is critical Section 13 – Developing a Forecasting Program
Summary (2 of 2) • Data types, sources, and issues • Standardize units • Continuously evaluate data quality • Forecasting protocol • Written procedures for forecasting • Saves time and improves quality of forecast • Forecast verification • Evaluate daily, monthly, seasonally • Categorical and discrete statistics • Set realistic goals • Some misses will occur Section 13 – Developing a Forecasting Program