Estimating Resilience, Thresholds and Regime Change
350 likes | 550 Vues
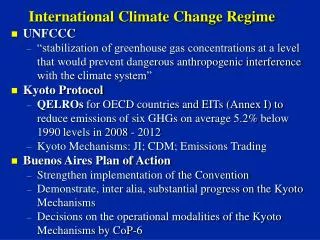
Estimating Resilience, Thresholds and Regime Change. Jan Sendzimir International Institute of Applied Systems Analysis Laxenburg, Austria sendzim@iiasa.ac.at. Outline. Review Resilience Regime Shifts Surrogates of Resilience Methods to find surrogates Examples of application Summary.

Estimating Resilience, Thresholds and Regime Change
E N D
Presentation Transcript
Estimating Resilience, Thresholds and Regime Change Jan Sendzimir International Institute of Applied Systems Analysis Laxenburg, Austria sendzim@iiasa.ac.at
Outline • Review Resilience • Regime Shifts • Surrogates of Resilience • Methods to find surrogates • Examples of application • Summary
Ecological SuccessionSouth-eastern North America Premise: system tends toward stable equilibrium Vegetation characteristic of different successional stages (After E.P. Odum 1971 Fundamentals of Ecology)
Hysteresis Percent Of Lake Covered By Macro- Phytes 1 28 2 27 3 26 4 5, 6…25 Response of charophyte vegetation in the shallow Lake Veluwe to increase and subsequent decrease of the phosphorus concentration. Red dots represent years of the forward switch in the late 1960s and early 1970s. Black dots show the effect of gradual reduction of the nutrient loading leading eventually to the backward switch in the 1990s.
Defining Resilience • Size of the Stability Domain • Amount of change a system can undergo and still retain the same controls1 on function and structure • Degree to which system can: • Self-organize • Learn and adapt 1 – set of reinforcing relations and feedbacks
Resilience:Three Levels of Meaning • Metaphor related to sustainability • A property of dynamic models • A quantity measurable in field studies
Panarchy a hierarchy of adaptive systems related by cross-scale interactions.
Resilience as MetaphorGuiding how we define its aspects To assess resilience in terms of a hierarchal context, measure the resilience of what to what. These aspects change depending on the temporal, social, and spatial scale at which one measures. Forest Stand Tree Crown Resilience at one scale can be subsidized by resilience at a broader scale in space and/or time. Panarchy -A Cross-scale Nested Set of Adaptive Cycles
Stability Landscape View of Evolution Shift from one domain to the next as the relations and feedbacks change As it changes, a system modifies its own possible states. Here a smaller and smaller perturbation can shift the equilibrium from one stability domain to another. Finally the stability domain disappears and the system spontaneously changes state.
Outline • Review Resilience • Regime Shifts • Surrogates of Resilience • Methods to find surrogates • Examples of application • Summary
Regime shifts at different speeds Shrubs Sediment Phosphorus Grass Lake water quality Stylized trajectories through time of the fast (---) and slow ( ) variables in lakes (thick blue lines) and rangelands (thin red lines) under high levels of phosphate inflow (lakes) and grazing (rangelands).
Regime Shift DatabaseFive Classes • Class 1. No linkage, externally driven change in ecological or social systems • Class 2. No linkage, internally driven change in the ecological or social systems • Class 3: Linked social–ecological systems, with a threshold change in only one system • Class 4: Linked social–ecological systems with reciprocal influences, but a shift in only one system • Class 5: Linked social–ecological systems with reciprocal influences, shifts in both the ecological and social systems Walker, B. and J. A. Meyers. 2004. Thresholds in ecological and social–ecological systems: a developing database. Ecology and Society9(2): 3. [online] URL: http://www.ecologyandsociety.org/vol9/iss2/art3
Regime Shifts–9 Categories Walker, B. and J. A. Meyers. 2004. Thresholds in ecological and social–ecological systems: a developing database. Ecology and Society9(2): 3. [online] URL: http://www.ecologyandsociety.org/vol9/iss2/art3
Clear Water RegimeControlling Processes • Phosphorus inputs from basin • Agric Methods (intensity & history) • Fertilizer type & application rate • Field size and shape • Buffer strips on field margins • Equipment size & use frequency • Soil Deposition related to soil type • Rain events (duration, frequency, intensity)
Turbid Water RegimeControlling Processes • Phosphorus recycling from lake bottom • Ecological components • Bethos sediment type • Macrophyte / algae ratio • Ratio bottom feeders / predators • Zooplankton that eat algae • Physical components • Storm events (intensity & frequency) • Lake shape and depth
Outline • Review Resilience • Regime Shifts • Surrogates of Resilience • Methods to find surrogates • Examples of application • Summary
Factors that challenge how we assess resilience • Context (indicators vary with it) • a web of relations that can change with time, spatial pattern, and the specifics of the local ecology and/or society. • Direct observation very difficult • events are rare, evidence may be dispersed in time and space. Manipulation impossible or unethical.
Resilience “Surrogate” • Contextual complexity • mandates that multiple models and multiple estimators be used in conjunction to measure different aspects of resilience. • Indicator – too narrow a term • to reflect this more systematic approach
Estimating Resilience Surrogates Interactive balancing between observation and modeling
Assessing R SurrogatesA Stepwise methodology • Step 1 – Assess and define “problem” • -What aspect of the system should be resilient and to what? • Step 2 – ID feedback processes • - What variables are changing? • - What drivers create change? • - What feedbacks reinforce or damp change? Bennett, E.M., Cumming, G.S., Peterson, G.D. (2005). "A Systems Model Approach to Determining Resilience Surrogates for Case Studies." Ecosystems8:pp. 945–957.
Assessing R SurrogatesA Stepwise methodology • Step 3 – Model the System Structure • What are the key elements and how are they connected? • - Feedback loops and related key variables. • Step 4 – Use model to identify Resilience surrogates • - What is the threshold value of the state variable and how far is it from the threshold? • How fast is the state variable moving toward or away from the threshold? Bennett, E.M., Cumming, G.S., Peterson, G.D. (2005). "A Systems Model Approach to Determining Resilience Surrogates for Case Studies." Ecosystems8:pp. 945–957.
Outline • Review Resilience • Regime Shifts • Surrogates of Resilience • Methods to find surrogates • Examples of application • Summary
Assessing Resilience:a potential qualitative approach Australian rangeland ranching Balancing the interaction between your economic initiative:debt/income ratio your ecological constraints: shrub/grass ratio
Variance – evidence of approaching regime shift? Field Data from lakes Whole lake manipulation by artificial forcing with added phosphorus exhibited increases in variance in phytoplankton biomass (Cottingham et al. 2000), and measures of variance in phosphorus recycling rates foretold threshold crossings one to two years in advance (Carpenter 2003).
Rising Variance of Phosphorus– a signal of approaching regime shift Carpenter, S.R., Brock, W.A. 2006. Rising variance: a leading indicator of ecological transition. Ecology Letters9: 311–318.
Possible Mechanism • Fast Variable (Phosphorus in water) • relaxes to equilibrium after small shocks. • Slow variables (Phosphorus in sediments) • SV change slow change in two attractors making regime shift more likely Variance (SD) in Fast variable increases In some types of systems, increased variability may occur over a wide zone of conditions near a transition, while in other types of systems the zone of increased variability may be so narrow as to be useless for empirical purposes.
Resilience Surrogates already proposed by social scientists • Organizational and institutional flexibility for dealing with uncertainty and change. • Social capital (including trust and social networks) • Social memory (including experience for dealing with change) Folke, C. (2006). "Resilience: The emergence of a perspective for social-ecological systems analyses." Global Environmental Changein press
SummaryCollaborating in assessing resilience • Methods • A version of Bennett et al. 2004 • Resources • Database of regime changes • Review of resilience surrogates already proposed by social scientists.
Resilience Indicator Fish Population Dynamics Model Rates of Birth and Mortality (per year) birth birth Fish Population Density (number per ha.)