Download
1 / 53
530 likes | 666 Vues
Western Air Quality Studies, 3-State Air Quality Pilot Study / Data Warehouse, and Western Regional Modeling Framework. April 16, 2014 Tom Moore WRAP Air Quality Program Manager WESTAR Council Salt Lake City, Utah Meeting. Regional Organizations.

E N D
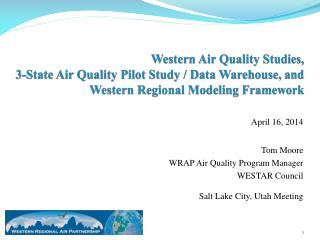
Western Air Quality Studies,3-State Air Quality Pilot Study / Data Warehouse, andWestern Regional Modeling Framework April 16, 2014 Tom Moore WRAP Air Quality Program Manager WESTAR Council Salt Lake City, Utah Meeting
Regional Organizations • WESTAR = Western States Air Resources Council • 15 state air agencies are voting members, ex-officio membership includes FLMs, also open to local air agencies and tribes, EPA active participant but not a member • Incorporated non-profit, offices in Seattle, Portland, and Fort Collins • www.westar.org • Purposes: • Exchange information related to air pollution control; • Develop processes and procedures to meet air quality objectives and to protect the environmental resources; • Discuss air quality issues and report on the status of efforts undertaken to achieve air quality objectives; • Establish work groups, task forces, as needed; and • Adopt resolutions and policy statements for implementation by Council members.
Organizations, continued • WRAP = Western Regional Air Partnership • www.wrapair2.org • Same 15-state region as WESTAR • Virtual organization, not incorporated • 60+ member agencies include 15 state air agencies, NPS, FWS, BLM, USFS, EPA, and interested tribes and local air agencies/districts in the WRAP region • Board has State and Tribal co-chairs, with representatives across states, tribes, federal, and local agencies. • Formed in 1997 to implement Grand Canyon Visibility Transport Commission recommendations • Led Regional Haze planning effort 1997-2009 for the West • 75 % of Class I areas in the WRAP region
- 15 states, federal land managers and EPA, tribes, and local air districts - Regional analyses for Western sources and air quality impacts
WRAP, continued • Since 2010, WRAP working as regional technical center to support and coordinate Regional Analysis and Planning • Develop and facilitate use of improved, consistent, comparable, transparent, and reproducible western air quality data • Interconnected series of regional technical projects • Management of ongoing emissions and modeling studies • Reviewed / coordinated with federal agencies, states, locals, tribes • External review by, and outreach to, industry and environmental groups • Staff work for WESTAR - report to WRAP and WESTAR Boards, and WESTAR Executive Director
WRAP regional technical support • NAAQS Implementation and Maintenance • Data for future infrastructure and transport SIPs • Exceptional Events • Develop technical support data and analysis protocols • Implementation of Regional Haze SIPs • Identify and execute technical work needed for 2018 plans • Needs of sub-regional groups of states • Currently oil and gas • Similar efforts in past
Western ozone and PM precursors - key emissions sources • Power plants decreasing markedly • Mobile sources controlled and emission rates decreasing markedly through federal rules and state testing programs • Fire activity and effects are huge, receiving intensive study • Deterministic & Empirical Assessment of Smoke’s Contribution to Ozone (DEASCO3) • Prescribed and Other Fire Emissions: Particulate Matter Deterministic & Empirical Tagging & Assessment of Impacts on Levels (PMDETAIL) • Others…. • Biogenics (natural plant sources) • Oil and gas (WRAP emissions inventories) • Emissions Inventories for Intermountain Basins with significant production • Currently completing ND-MT Williston and MT North Central (Great Plains) Basins • Coordination for 3-State Air Quality Study • All sources studied in comprehensive regional modeling analysis • 2008 base year - West-wide Jumpstart Air Quality Modeling Study (WestJumpAQMS)
Power Plant Emissions Trends – Western Interconnect Data Source: EPA Clean Air Markets Division
Fire The Big Picture
West-Wide Jumpstart Air Quality Modeling Study(funding by State of NM, BP, and BLM national air program) • Regional results provide data and context for state and federal planning • Uses most current transport and background studies • Meteorological and emissions modeling • Regionally consistent, High resolution, Comprehensive • Photochemical modeling • 2008 base case model performance evaluation with Ozone / PM source apportionment • Most up-to-date and complete characterization of Western U.S. air quality available • Study completed September 2013 • Emissions and Modeling data foundation of 3-State Data Warehouse • All materials at: http://www.wrapair2.org/WestJumpAQMS.aspx • Advances goal to provide a regional modeling framework
Tracking and Managing Smoke • Significant impacts to both local and regional air quality • Large summer wildfires • Prescribed and agricultural burns in spring and fall • States & tribes manage both planned burns & wildfire impacts • FLM Joint Fire Science Program projects enable continuing operation of WRAP’s Fire Emissions Tracking System (http://www.wrapfets.org/) • Used daily by western states, tribes, and federal agencies to track planned fire and manage smoke • FETS • Used by states and OAQPS to evaluate 2008 NEI • Fire activity and emissions data being sent to EPA for 2011 NEI
Fire’s Effects on Elevated Regional Ozone & PMDeterministic & Empirical Assessment of Smoke’s Contribution to Ozone (DEASCO3) – completed Summer 2013and leveraged companion study underway:Prescribed and Other Fire Emissions: Particulate Matter Deterministic & Empirical Tagging & Assessment of Impacts on Levels (PMDETAIL) Funding for both from FLM Joint Fire Sciences ProgramBoth projects, analysis toolbox / data, and FETS access at: http://wraptools.org/New proposal under JFSP review: Contribution of Smoke Emissions to Secondary Organic Aerosols (SOA): Real-World Evaluation of Fire SOA Emissions Factors from Fires in a Data Management System (REFERS-DMS)
Leveraging Improved AQ Planning EPA NEI & WRAP Western Data WestJumpAQMS Exceptional Event applications PMDETAIL DEASCO3 2008 WRAP Fire and NEIv2 Fire data (USFS collaboration)
WRAP Fire Tools Landscape WRAPTools Website WRAPTools Retrospective Analysis System • Fire Emissions Tracking System • Gathering daily WF and S/L/T data • QA/QC and reporting tools for activity, emissions, NEI • DEASCO3 • JFSP-funded project • DSS for Ozone impacts • Temporal analysis, area impacts • PMDETAIL • JFSP-funded project • DSS for PM impacts • Temporal analysis, vulnerability matrix DEASCO3 Project Site PMDETAIL Project Site FETS Website FETS database
WRAPTools Toolbar Approach What questions do we need to address to perform retrospective case study analyses? What data are available to us? How do we organize results to accommodate differing analysis types? • Start with basic criteria from user: time, space • Build a set of modular tools that produce analysis results • Build a one-page “workspace” and plug in tool results, commentary.
Smoke and Emissions Inventory Research Fire and Smoke Model Validation Smoke and Populations
Temporal Analysis Tools Model Validation Fire Contributions to AQ Impacts Inter-annual Observational Analysis
2004 6/20 – 8/31 Limited by bounding box
2005 6/20 – 8/31 Limited by bounding box
2006 6/20 – 8/31 Limited by bounding box
2007 6/20 – 8/31 Limited by bounding box
2008 6/20 – 8/31 Limited by bounding box
Where do your data go, how are they used? SMP Data Data Export S/L/T NEI data FETS Website Satellite-derived Data FETS database SIP-grade EIs (‘02,’08,’11…) WRAPTools Website Annual fire climatology MTBS Data User-supplied data maintain their identity throughout the system
Track activity and emissions Determine source impact / contribution Fire Activity Data (acres/day) distribute emissions FETS DEASCO3 & PMDETAIL Loading Moisture Chemical Profiles loft emissions Emissions Model
Completed DEASCO3 project - purpose & goals • Assess fire’s impact on elevated ozone episodes with retrospective studies • Studies of fire and ozone in 2002 through 2008 • Tools and data at: http://deasco3.wraptools.org/ • Outcomes • Support future collaborative FLM-state ozone air quality planning • Developed “lessons learned”, basic analysis rules for fire-ozone episodes, and online tools for FLM-state air quality planning • Through WRAP FETS, prepared and implemented planning-grade fire emissions inventories in FETS suitable for SIP work by states & FLMs • Published data and analysis results in transparent and reproducible formats • Collaboration involved EPA western RO and FLM staff, leverages WestJumpAQMS • Products for FLMs and states to use in SIP process and Exceptional Events demonstrations
Particulate Matter Deterministic & Empirical Tagging & Assessment of Impacts on Levels (PMDETAIL) • https://pmdetail.wraptools.org/ • 3-year project, JFSP-funded • Completion target Sept. 2015 • Team = WESTAR/WRAP, Air Sciences, ENVIRON, CMU, and CSU • Study Objectives • Quantify the impact of prescribed and other fire sources on particulate matter (characterized as PM2.5 and PM10) levels across the continental U.S. • Develop new fire emissions inventories and computational modules for chemical transport models to simulate the atmospheric transformations of these emissions • CAMx and PMCAMx models and inventories will be evaluated against field measurements for 2002, 2008, and 2011. • CAMx is a publicly available chemical transport model (CTM) used for regulatory purposes, while PMCAMx is its research version developed by the CMU team. • Based on leveraging and significant extending emission inventory development and CAMx modeling from the Deterministic and Empirical Assessment of Smoke's Contribution to Ozone (DEASCO3) study completed in 2013.
FETS, Present and Future • Developed and on-line in 2007 • Continuing processing / addition of each year’s data from SMPs • Continuing to add new SMPs • Exploring additional sources of daily wildfire incidence data • Leveraged JFSP projects have covered very limited FETS maintenance support • Datasets from JFSP projects and ongoing FETS data collection converging on WRAPTools (https://wraptools.org/) • High-priority, critical infrastructure maintenance tasks underway • Outreach process to WRAP region SMPs to assess needs for additional functionality and identify collaboration activities
Regional Haze: Reasonable Progress Reports(EPA grant funds for contractor support) • WRAP produced a comprehensive, regionally-consistent technical report – completed Summer 2013 • Regional, state, and Class I area reports • Technical analyses required by Regional Haze Rule • Western states will use as a common basis in preparing individual SIP revisions • SIP revisions are due in the 2013-15 timeframe • WRAP providing western 2008 emissions data • Leveraged from WestJumpAQMS • States will use to evaluate changes in monitored visibility • Project reports at: http://www.wrapair2.org/reghaze.aspx
Oil & Gas: Emissions Inventories and Control Analysis(funding by Western Energy Alliance , EPA, States of WY and ND, BLM) • Key source for Ozone / PM standards, & Regional Haze • Exploration and production activity continue to increase • Data in use current OAQPS national & western modeling work • Significant funding and involvement by industry • Open review and discussion process with all interested stakeholders • Linkages • WestJumpAQMS • 3-State Air Quality Study • O&G EI project funded by BLM MT-Dakotas office • 2011 base & projection years’ EI for Williston & Montana Great Plains Basins
Cross-Basin – Per-Well NOx Emissions Per well NOx emissions relatively consistent across basins – differences mainly due to usage of compression and centralized vs. wellhead compression 39
Cross-Basin – Per-Unit-Gas-Production VOC Emissions Per unit gas production VOC emissions vary widely across basins – differences due to levels of liquid hydrocarbon production (oil and condensate) and VOC content of produced gas 40
Cross-Basin – Per-Unit-Liquid-Production VOC Emissions Per unit gas production VOC emissions vary widely across basins – differences due to levels of liquid hydrocarbon production (oil and condensate) and VOC content of produced gas 41
Issues – Missing Categories Produced water (evaporation) ponds • Emission factors uncertain and highly dependent on composition, production type • Seasonal/diurnal variations • See for example Utah State University work to characterize emissions in Uinta Basin 42
Issues – Missing Categories Field gathering pipelines • Lack of data on extent of pipeline infrastructure within fields • Pipeline companies historically not part of the inventory process 43
Issues – Missing Categories Midstream sources • Midstream sources not always captured in inventories – state reporting thresholds • Midstream sources on tribal lands • Midstream companies historically not part of the inventory process 44
Issues / New Concepts – Non-routine events, Skewness • Pipeline blowdowns • Spills/upsets • Maintenance activities • Poorly performing and “non-average” sources could have significantly higher emissions than estimated in inventories • Analogous to “smoking vehicles” in mobile source inventories • Statistical sampling/monitoring of sources needed to develop methods to represent this in inventories • See for example NOAA monitoring in Uinta Basin and CDPHE capture efficiency adjustments 45
Issues and New Concepts – Gas Compositions • Gas compositions in Phase III use a basin-average approach • Variability within a basin by production type (field to field) • Variability within the production/gathering system • More data needed – field or formation level approach for basins? Conventional Gas (Vented/Fugitive Sources) Flash Gas (Condensate and Oil Tanks) 46
Issues and New Concepts – Factors and Uncertainty • New factor data • Fugitive emissions • Venting from well completions • Water tanks / evap ponds • Uncertainty • Uncertainties not quantitatively estimated in most inventories • Large data sets needed to estimate uncertainty • Helpful in identifying poorly-characterized sources, and estimating uncertainty in AQ modeling 47
Federal Leadership Forum / 3-State Air Quality Study(funded by BLM, USFS, EPA, others in-kind) • Steering committee of WY, CO, UT, EPA, BLM, NPS, and USFS • Implementation of 3-State and national MOUs’ objectives • Planning for air quality impacts of energy development • Ozone focus, additional rural monitoring stations in oil & gas basins • Wintertime ozone nonattainment areas • Integrates results from WestJumpAQMS and Oil & Gas projects • Data warehouse to support future air quality modeling and other analyses
3SAQS 4km Modeling Domain – discussed and recommended at Oct. 31-Nov. 1 Technical Committee Workshop
3-State Air Quality Study - Objectives • Facilitate more complete and consistent AQ Analysis for NEPA and other AQ decisions • Improve timeliness and collaboration • Reduce duplication of AQ analysis resulting in lower costs • Improvements include or will include: • Six new monitoring sites • More region-specific modeled emissions • More current base case and better future case air quality modeling • A data warehouse to contain all this improved information and future data for access by agencies and those they approve to use it