Download
1 / 63
670 likes | 870 Vues
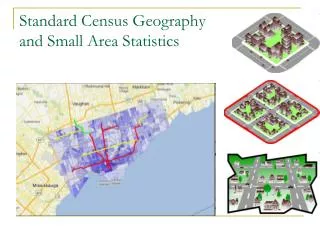
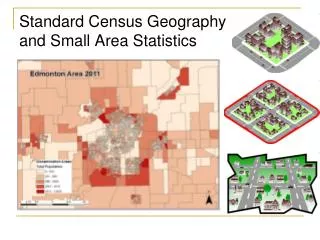
Standard Census Geography and Small Area Statistics. Place as a location, a unit within a hierarchy of units in space. Place as a unique artifact constructed by experience. Tiny hamlet’s disappearing act highlights 2011 census flaws. Toronto Star Tuesday, October 1, 2013.

E N D
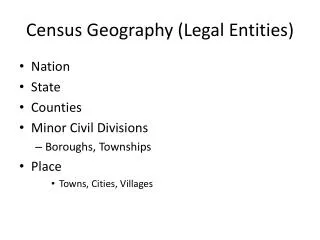
Place as a location, a unit within a hierarchy of units in space Place as a unique artifact constructed by experience
Tiny hamlet’s disappearing act highlights 2011 census flaws Toronto Star Tuesday, October 1, 2013 http://www.thestar.com/news/canada/2013/09/30/tiny_hamlets_disappearing_act_highlights_2011_census_flaws.html
Objectives today - to build understanding of: The standard of terminology and hierarchical structure of Census geography, to understand commonly accessible smaller units Other small geographical units important to statistical display which are important/frequently requested Key Statistics Canada tools to understand their geographic standard, and find small-area standard statistics Standard Census Geography and Small Area Statistics
Geography and Statistics: the ‘Where” Statistics always have a ‘where’ The importance of the ‘where’ varies depending on what you’re examining Everything is related to everything else, but near things are more related than distant things. First Law of Geography (Waldo Tobler)
Geography and Statistics: the ‘Where” • Geographic standards are a key method by which disseminated statistics are organized • ‘Where’ statistics – when the ‘where’ question is a ‘small area’ – present unique challenges
Population Reference Bureau 2013 World Population Data Sheet Strange Maps : A Cartogram of the World's Population
Statistics Canada Geographic Unit Hierarchy http://www.statcan.gc.ca/pub/92-195-x/2011001/other-autre/hierarch/h-eng.htm
UnitedStates Census Bureau Statistics South Africa http://mapserver2.statssa.gov.za/geographywebsite/about.html http://factfinder2.census.gov/faces/nav/jsf/pages/using_factfinder5.xhtml Information has a where and a spatial relationship
Dwelling a set of living quarters collective dwellings and private dwellings Why not just report at this spatial level? 1911 Micro Census of Alberta https://sites.google.com/a/ualberta.ca/opendata/data To dwell in a house is not merely to be inside it spatially in the sense just canvassed. Rather, it is to belong there, to have a familiar place there. http://www.statcan.gc.ca/concepts/definitions/privdwel-logpriv-eng.htm
A brief hierarchy overview All levels of the hierarchy have definitions and corresponding codes (codes are key) Canada – 00 Alberta (Province) – 48 The levels and codes have defined relationships Below Provinces, we have Census Divisions (CD): eg 4801 Below Provinces, Census Metropolitan Areas (CMA) and Census Subdivisions (CSD) Below those Census Tracts (CT) & Dissemination Areas (DA) - StatsCan’sSMALL AREA STATISTICS
The Census Geography Hierarchy Organizing a national system of statistical reporting depends on a full-coverage nested geographic hierarchy The hierarchy helps to ensure 100% coverage of the population during Census collection by organizing the country’s geography
Building a Census Subdivision Code • Province (Alberta) • 48 • Census Division (Census Division 11) • 4811 • Census Subdivision (Census Subdivision 061) • 4811061 • 4811061 = Edmonton Is there a tool that provides a complete overview of the census hierarchy?
Census Consolidated Subdivision (CCS) Smaller, more densely-populated Census Subdivisions (towns & villages) are combined with the surrounding, larger, more rural Census Subdivision, in order to create a geographic level between the Census Subdivision and the Census Division. Leduc Leduc County Census of Agriculture
Census Subdivision Type (CSDtype) • CY City • SV Summer village • T Town • VL Village • Municipal District 48 11 016 http://www12.statcan.gc.ca/census-recensement/2011/ref/dict/table-tableau/table-tableau-5-eng.cfm
DA - small area composed of one or more neighboring Dissemination Blocks (DB), with a population of 400 to 700 persons.
CCSUID CDUID CSDUID PRUID DAUID
1931 1921 1911 Historical Census Sub-Divisions Alberta Total Population 1951 1941
8350023.00 https://www12.statcan.gc.ca/census-recensement/2011/ref/dict/geo013-eng.cfm
Building a Census Tract Code Area that is small and relatively stable. Census tracts usually have a population between 2,500 and 8,000 persons. They are located in census metropolitan areas and in census agglomerations that have a core population of 50,000 or more. • Census Metropolitan Area (Edmonton – 835) • 835 • Census Tract (Census Tract Name = 0067.00) • 8350067.00 • 8350067.02 = ?
DA - small area composed of one or more neighboring Dissemination Blocks (DB), with a population of 400 to 700 persons.
EdmontonNeighbourhood Boundary Files $$ Stats Can
The Census Geography Hierarchy • The hierarchy also defines ‘level’ of the release of statistics • Small area statistics exist at the ‘bottom’ (yet $$) end of the hierarchy
Expense and access Authoring agencies, because of budget limitations, sometimes have to strike balance between availability of variable detail and finer levels of geography
Expense and Access More variables? > $$$ Smaller geography? > $$$ !! Thanks Data Liberation Initiative! Thanks, Open Data movement! Thanks, new discovery tools!
Great StatsCan Geography Tool for understanding the hierarchy Illustrated Glossary Overview Tutorial: http://www.statcan.gc.ca/pub/92-195-x/92-195-x2011001-eng.htm Well-defined geographic areas provide the framework for the collection, presentation and analysis of data.
Hierarchy continued Hierarchy is defined administratively (ie political decision) and statistically (ie StatsCan’s reporting requirements) Not everything in the hierarchy relates to every other unit (see chart); i.e. not a straight, linear hierarchy Eg. Forward Sortation Areas Odd units: ‘Designated Places’
Hierarchy Caveats Not all statistics are available for all levels of the hierarchy; parts of the hierarchy may not exist in some places Note: The Geography may exits but not the attributes (Postal Codes) Statistical analysis is more appropriately applied to some units than to others: eg. CMA vs CSD
Privacy and confidentiality Keeping the unit of analysis anonymous is a challenge with small area information (if one has good local knowledge, you can identify a person) There are rules in place about what population counts are required in order for small area statistics to be released (e.g. income)
Small Area Statistics: A context for understanding geographic standards Small area statistics: Help us understand the broader geographic standard of stats dissemination from Statistics Canada Are essential for certain types of analyses Can be challenging to find, understand and to work with; Can answer local and very specific questions Can be expensive to produce and obtain (i.e. present access challenges)
What are ‘small area statistics’ about? High demand for information at the ‘lowest geographic level available’ Statistics at sub-provincial, or sub-municipality level, are critical to analyses of: Health (e.g. spread of disease), Housing, crime, social issues (e.g. emerging patterns of concern or interest), Emergency response (analysis of this doesn’t work at a whole-municipality level), Market analysis (often derived from postal code geography) Municipal planning
John Snow’s Cholera Outbreak Map Street map of cholera deaths in Soho in 1853 from John Snow's On the Mode of Communication of Cholera
This is a map of every person counted by the 2010 US, 2011 Canadian, and 2010 Mexican censuses. The map has 454,064,098 dots - one for each person. http://www.theatlanticcities.com/design/2012/12/mapping-census-dot-every-person/4273/
Edmonton – Calgary Corridor Census Dot Map 2011 DA - Total Population CCS - Population 1 Dot = 1 Person
Atlanta http://www.coopercenter.org/demographics/Racial-Dot-Map
Mapping the seven deadly sins US Census Data (County Level) • Greed: Average incomes versus total inhabitants below the poverty line • Envy: Total number of thefts (robbery, burglary, larceny, and stolen cars) • Wrath: Total number of violent crimes (murder, assault and rape) per capita • Lust: Sexually transmitted diseases per capita • Gluttony: Number of fast-foot restaurants per capita • Sloth: Expenditures on arts, entertainment and recreation versus rate of employment • Pride: An average of the six other sins GiZScore is the Z-Score from the Gi* test for spatial clusters http://blog.revolutionanalytics.com/2009/05/mapping-the-seven-deadly-sins.html