Download
1 / 6
60 likes | 174 Vues
Learn how to analyze crystal Rint values, apply corrections for crystal quality, and reduce data effectively in crystallography experiments. Understand the importance of Rint thresholds and data processing steps.

E N D
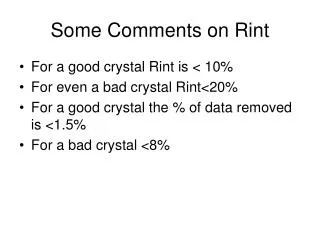
Some Comments on Rint • For a good crystal Rint is < 10% • For even a bad crystal Rint<20% • For a good crystal the % of data removed is <1.5% • For a bad crystal <8%
Very Large Values • Sometime get very large values for both Rint and % removed. • This always means you are in the wrong crystal class • Example monoclinic with beta = 90 • Tetragonal that is orthorhombic
Data Reduction • The data measured is inensity • It needs to be converted to Fobs or Fobs2 • There are two corrections. • Polarization –because x-ray beam is not polarized and diffraction is not in plane of polarization =(1+cos22q)/2 • Lorenz Factor is a function of the instrument type and setup • |F|=(I/Lp)1/2
What have we done so far? • Found and mounted a crystal • Checked its quality • Determined the unit cell • Collect a set of frame data • Integrated the frames • Scaled the frames—combined equivalent reflections • Reduced the data • Formatted the data
What is next for the data • Correct for absorption if needed • Integrated absorption correction • Empirical absorption correction • A “fudge” correction later • If we are going to do a correction a file containing direction cosines on unaveraged data is required • Correct for decay if needed