Download
1 / 15
150 likes | 287 Vues
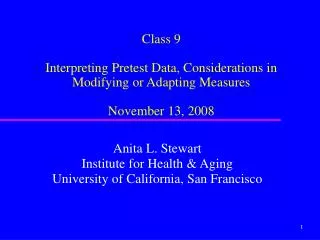
Students are use to interpreting this…. NOAA National Weather Service Forecast Offices. H. H. H. L. L. Here’s a satellite image of the Gulf Stream. Front. Front. Coastal Ocean Observation Lab Operations Center “The COOLRoom”. Collaboration Table. A “Stommel” View of the Ocean.

E N D
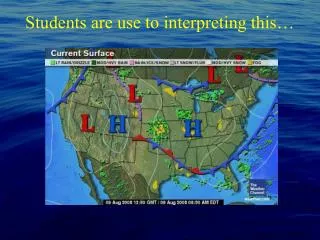
H H H L L Here’s a satellite image of the Gulf Stream Front Front
Coastal Ocean Observation Lab Operations Center “The COOLRoom” Collaboration Table A “Stommel” View of the Ocean Research Ops Command & Control Station CODAR Network L/X-Band Satellite Systems Glider Fleet
Continuous vs. Discrete Data • Data can be categorized in many ways, but one of the most important distinctions is between data • that is “continuous” and that which is “discrete”. • Continuous data is data that assumes a range of responses on a continuous scale. • An advantage of continuous data is the ability to see data in context, to get the “bigger picture.” • Some examples of continuous data are: • Temperature • Salinity • How quickly a wave accelerates • Continuous data measures a wide range of values. It is usually gathered by measuring, with some • associated level of precision. These examples can be divided into smaller measures. • Let’s take the example of the accelerating wave. If you measured the speed exactly five seconds after • the wave was generated, the value would depend on the accuracy of the instrument used to make the • measurement. It could be 35 mph, 35.1, 35.15, 35.1522356, and so on. • It is not possible to count all continuous data values.
Continuous vs. Discrete Data • Discrete data on the other hand seems much simpler, and is based on counting. Some examples of discrete data are: • The number of whales in a pod • The number of trips one takes to the beach in a summer • How many seashells Sally sells at the seashore on Saturday • When all possible values in a data set can be counted the data set is said to be discrete. Here is a simple tool that was created to illustrate to students the difference between continuous and discrete data. It illustrates the advantage of having a continuous stream of data helps us see the “whole picture”
What happened? 8/8