Download
1 / 34
350 likes | 431 Vues
Learn about ACT, a non-profit providing assessment and research services, and how colleges use ACT test scores in admissions. Understand College Readiness Benchmark Scores and their significance.

E N D
Accessibility in Admissions April 27, 2010
About ACT • ACT is an independent, not-for-profitorganization that provides more than a hundred assessment, research, information, and program management services in the broad areas of education and workforce development. • Each year, we serve millions of people in elementary and secondary schools, colleges, professional associations, businesses, and government agencies, nationally and internationally. ACT has offices across the United States and throughout the world.
Annual ACT Test Takers • 2009 Graduating Seniors = 1,480,469 • 2008-2009 Tested Juniors = 1,086,163 (PLAN Tested Sophomores = 1,024,164) Over 2.5 Million Students Tested Each Year
8/84 18/53 78/3 54/22 68/7 25/81 33/51 67/5 100/5 58/18 74/3 More than 50% of graduates taking the ACT More than 50% of graduates taking SAT CT 21/80 DC 30/74 DE 11/69 MA 18/79 MD 17/67 NH 15/72 NJ 16/73 RI 10/64 VT 24/61 99/5 14/69 59/3 64/22 72/4 24/62 97/6 30/40 62/18 68/6 20/67 100/20 67/4 100/7 74/7 19/49 15/62 92/10 70/5 50/66 73/5 16/26 65/11 40/70 76/7 93/4 89/6 30/51 29/46 62/58 22/58 2009 Percent of Graduates Taking ACT/SAT Source: 03/2008 WICHE data for number of H. S. Graduates per state, ACT Annual State Reports, College Board Annual State Summary 08/09
ACT Tested by State 2009 2,008 1,438 12,285 2,469 5,960 5,791 43,642 13,093 11,560 46,658 47,520 1,309 10,228 6,676 121,982 9,240 5,530 21,199 17,679 22,377 16,286 88,754 1,060 6,396 143,791 17,321 11,696 11,317 23,229 17,902 51,087 46,923 1,548 23,147 45,419 81,494 13,347 52,052 27,054 18,691 22,523 12,550 12,434 25,976 36,165 35,809 82,640 34,548 2,254 105,297 3,115 > 100,000 70,000–100,000 40,000–70,000 20,000–40,000 10,000–20,000 < 10,000 Source: WICHE: Knocking at the College Door 2/2008 - Projections of H.S. Graduates by State
Barriers in College Admissions • Communicate college readiness • Communicate college needs & preferences • Connecting with the right college/university • Accessing college admission tests • Inadequate parental or high school guidance
College and Career Readiness System Longitudinal Assessments * 11th–12th Grade Score Scale: 1—36 • 8th–9th Grade • Score Scale: 1—25 10th Grade Score Scale: 1—32 English, math, reading, science, optional Writing Test (ACT only) Career and Educational Components *Colorado administers the ACT to all public high school juniors
College Readiness Benchmark Scores • Minimum ACT test scores required for students to have a high probability of success in credit-bearing college courses • Empirically derived based on actual performance of college students • Established using data from 98 institutions and over 90,000 students
College Readiness Benchmark Scores The minimum score needed on an ACT subject-area test to indicate a 50% chance of obtaining a B or higher or about a 75% chance of obtaining a C or higher in the corresponding credit-bearing college courses. EXPLORE
% By Colorado Region Meeting ACT English College Readiness Benchmark % Meeting Benchmark 2009 Grad Class
% By Colorado Region Meeting ACT Math College Readiness Benchmark % Meeting Benchmark 2009 Grad Class
% By Colorado Region Meeting ACT Reading College Readiness Benchmark % Meeting Benchmark 2009 Grad Class
% By Colorado Region Meeting ACT Science College Readiness Benchmark % Meeting Benchmark 2009 Grad Class
% By Colorado Region Meeting All ACT College Readiness Benchmarks % Meeting Benchmark 2009 Grad Class
The ACT and Access • A high percentage of colleges use test scores as one factor in the admissions process • 81% require or use the ACT and/or the SAT in the process* *From ACT’s Annual Institutional Data Questionnaire
The ACT and Access • When a student takes the ACT, colleges are able identify and reach out to potential students through: • ACT Score Reports (sent by students) • Educational Opportunity Service (search) • Colleges are able to facilitate access by using these to connect students with appropriate campus programs and resources
Recent ACT Research Findings Related to Yield • Score-senders will typically be the highest-yielding initial source code (aside from applications) in an inquiry pool • Students sending official score reports are more likely to enroll than ACT-tested students who do not send official scores • The more scores a student sends, the more likely they are to enroll • Sending multiple scores shows continuous interest over time
State Testing Is a Great Equalizer • More males • More minority students • More middle and lower-income students • More first-generation students • Result… • More opportunities to increase access and participation
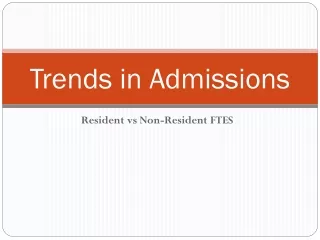
Comparison of Colorado ACT-Tested Juniors Before and After State Testing
The Impact of Testing in Colorado & Illinois on College Enrollment • 13% of Colorado students who had not planned to attend college at the time of testing ended up enrolling in college the next year (18% in Illinois)* • From 2002 to 2007, the percentage of CO and IL high school grads enrolled in college the following fall increased by 1 and 2 percentage points, respectively* *2009 Case Study – Statewide Administration of the ACT: A Key Component in Improving Student Access to College and Work
The ACT Student Record More than a score…
Overview of Student Data in the ACT Record • Personal/demographic data • Admissions/recruitment data • ACT Scores, norms, and prediction research • High school courses and grades • Educational plans, interests, and needs • Activities and accomplishments More than 265 fields of data provide a complete student profile:
ACT Academic Data • ACT Scores, Norms and Percentiles (42 items) • Prediction Research (30 items) • HS Grades and Courses (80 items)
ACT Student Profile Data • Admission/Enrollment Information(5 items) • Factors Influencing College Choice(12 items) • Educational Plans, Interests, & Needs(6 items) • Special Educational Needs, Interests,and Goals (8 items) • Interest Inventory (22 items)
ACT Student Profile Data (cont.) • High School Information (5 items) • Financial Aid (4 items) • Out-of-Class Accomplishments (21 items) • High School Activities/ College Extracurricular Plans (26 items) • Background (4 items)
Key Points about Personalizing, Customizing, Segmenting • A school’s ability to segment, customize, personalize and target is entirely dependant on the amount of student-level information available … and when it’s available • Through the ACT student record colleges have… • the most complete information available • at the earliest point in the recruitment cycle • in the most portable format
Examples of Postsecondary ACT Data Use • University of Toledo • Multicultural Recruitment – Target schools with large percentages of African American/Latino students that meet admission/scholarship requirements and look at ACT trends within targets • Assist UT Band Department by providing mailing lists of score senders where UT is 1st-3rd choice and express an interest in college band • Assist Greek Life Department by providing list of score-senders expressing an interest in fraternities and sororities
Examples of Postsecondary ACT Data Use • University of Toledo (continued) • Identify students who won a science award in high school and send an e-invite encouraging attendance at science-related Summer Career Friday programs • Contact students that indicate an interest in Study Abroad programs about those opportunities at UT
Examples of Postsecondary ACT Data Use • University of Colorado at Colorado Springs • Targeted messaging based on indicated student college choice • Postcard campaign with targeted messaging to “search names” based on score ranges, geographic regions and academic interest
Examples of Postsecondary ACT Data Use • Colorado State University • Starting to make ACT score sender data available to advising community in hopes of reaching and advising students earlier (student data can help trigger new conversations in one-on-one advising) • Using family income data to target Pell-eligible students to inform them early about financial planning and CSU’s “Land Grant Award” • Identified & contacted 2200 Colorado seniors this year • 560 have applied for CSU admission
Examples of Postsecondary ACT Data Use "Without information like this from the ACT, Colorado State wouldn’t be able to let Pell-eligible families know all the support that we can offer them until they submit a FAFSA late in the process. Since our primary access-related goal on this front is to not let families with low-income self-select themselves out of even applying, utilizing this one simple piece of information and having it the minute a student sends us test scores is a profoundly impactful moment for reaching a student as much as 12 months earlier than ever before.” – Jim Rawlins, Executive Director of Admissions, Colorado State University
Contact Information Joe Cruse Consultant, ACT West Region 3131 S. Vaughn Way, Suite 218 Aurora, CO 80014 303.337.3273 phone 303.337.2613 fax joe.cruse@act.org