Query Visualization: Revealing Search Patterns
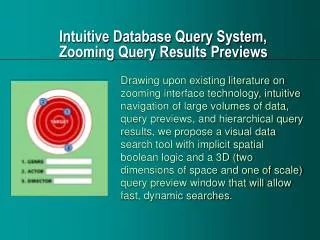
Explore relationships in search behavior by visualizing queries and clicks. Analyze seasonal and time-of-day impacts on user searches. What could the patterns reveal? Use Actionscript 3, Wordnik, and Photoshop to group data and create a dynamic visualization environment.

Query Visualization: Revealing Search Patterns
E N D
Presentation Transcript
Database Query Visualization By: Brent Arata
Why Visualize a Search Query • Relationship between what people actually search for and what people actually click on • To see if the season has any effect on what people look for. • To see if time of day has any effect on what people look for.
Resources • Actionscript 3 • Wordnik • Photoshop
To Do List: • To display something on the screen • Group the data by using the tools provided by Wordnik • Create a timed environment in which the tree can grow