IPCC Climate Change Report
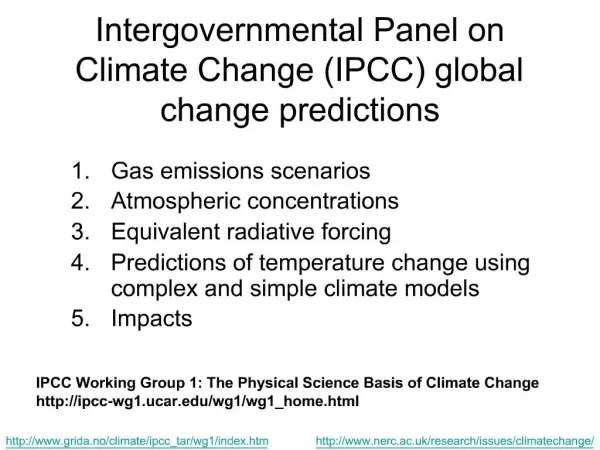
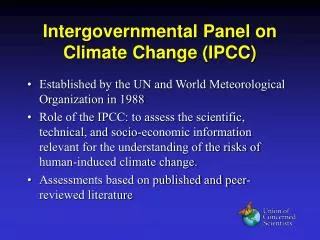
This report highlights the evolution of the Intergovernmental Panel on Climate Change (IPCC) consensus over time, demonstrating increasing confidence in the human influence on global warming. From early indications in the First Assessment Report (FAR) to the robust findings of recent reports, the evidence shows that rising temperatures are primarily due to human activities such as greenhouse gas emissions. It further discusses potential climate impacts, including species extinction, coral deaths, and changes in agricultural yields, and emphasizes the importance of accurate modeling and understanding feedback mechanisms in climate science.

IPCC Climate Change Report
E N D
Presentation Transcript
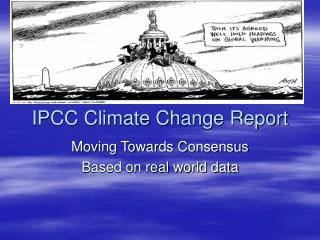
IPCC Climate Change Report Moving Towards Consensus Based on real world data
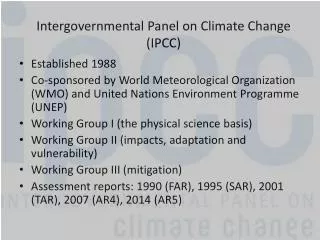
IPCC Consensus Evolution • FAR: 1990: The unequivocal detection of the enhanced greenhouse gas effect from observations is not likely for a decade or more • SAR: 1995: The balance of evidence suggestions a discernible human influence on global climate
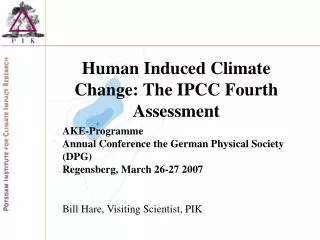
Getting Stronger • TAR: 2001: There is new and stronger evidence that most of the warming observed over the last 50 years is attributable to human activities • AT4: 2007: Most of the observed increase in globally averaged temperatures since the mid-20th century is very likely due to the increase in anthropogenic greenhouse gas concentrations.
Basic Approach • Coefficient of doubling CO2
Basic Future Predictions • A 2°C rise from today's temperatures produces 30% species extinction • A 3°C warming will lead to widespread coral deaths • Water availability in the moist tropics and in the high latitudes will increase, but will drop in the semi-arid low latitudes • A 1°C warming will decrease agricultural yields in the low-latitudes; 2°C increases yields at high latitudes
Preponderance of Evidence • Want to find indicators of climate change • Requires a) a robust definition and measure of what constitutes climate and b) an instrumental precision sufficient to measure change • No one indicator (e.g. smoking gun) exists; aggregate of all data then forms the preponderance
Central Europe Summer Signal • Huge statistical signal via baseline/area test
Global Aerosols – leads to dimming • Mostly Industrial; African Source is pyrogenic and biogenic in nature (drought related)
Convolution of positive and negative forcings are what we observe. • GHG produces the net positive here
Other indicators • Sea Ice • Glacial retreats and glacial mass balance • Permafrost • Droughts • Water vapor feedback • Cloud cover • Ocean wave heights • Sea surface temperature anamolies
Glacial Retreat and Mass Balance 1941 - 2005
Cloud Cover • Extremely difficult to really measure with any accuracy • Extant data are inconclusive and noisy
Ocean Sea Surface Temperature Response • Its important to realize that virtually all of the extra (heat) flux goes into the oceans
Big reservoir of heat • 0.1 degree C increase transferred (instantly) to the atmosphere produces 100 degree C increase. • Ocean circulation and redistribution of excess heat is (fortunately) a slow process • But that is where the “pipeline” warming is even if CO2 was stablized today!
Sea Level Rising • Sea Level measured at San Francisco
Known SST oscillations increasing in amplitude • North Atlantic Oscillation (notice the post 1995 slope):
Complete Feedback Models too Difficult to reliably construct
Source of Uncertainties • Roles of clouds and aerosols in radiative transfer models? (e.g. scattering!) • Role of tropical convection and the water vapor feedback loop? • How well do observations constrain the input climate parameters? • How to weight the inputs for best fit statistical model? • Contributions of other greenhouse gases specifically methane from permafrost release
Global Warming Potential • TH = Time Horizon (20 or 100 years) • Ax = increased forcing from X (Watts m^2 kg) • x(t) = decay following some hypothetical instantaneous release of X • Denominator is relevant quantities for CO2 • Nominal value for Methane is 21
Do Tipping Points Exist in Climate? • Does the system have critical phenomena? Or do the various and somewhat unknown feedback mechanisms serve to counter this?
The Next Level of Physics in Climate Science • More strongly incorporates the role of various feedbacks particularly water vapor • Identifying critical points (or lack thereof) is essential in future models • Improved modeling of aerosols and their scattering properties • Improved modeling of tropical convection to better understand ocean/atmosphere heat exchange