Download
1 / 53
530 likes | 551 Vues
This topic explores the impact of anthropogenic greenhouse gas changes and their contribution to radiative forcing in climate change. It discusses the long-lived greenhouse gases, evaluating their trends and the overall climate response. The concept of radiative forcing is explained, along with the factors and agents involved. Limitations and the comparison between human activity and natural influence on climate change are also explored.

E N D
Center of Ocean-Land-Atmosphere studies CLIM759: Topics in Climate Dynamics GEOG 670: Applied Climatology Physical Science Basis of Climate Change: IPCC 2007 Chapter 2: Changes in Atmospheric Constituents and in Radiative ForcingPart 1 Emilia K. Jin Feb 12, 2008
Contents Center of Ocean-Land-Atmosphere studies • Anthropogenic greenhouse gas changes • Aerosol changes and their impact on clouds • Surface albedo changes • Natural solar and volcanic mechanism
LLGHGs Center of Ocean-Land-Atmosphere studies • The long-lived greenhouse gases (LLGHGs) • Carbon dioxide (CO2) • Methane(CH4) • Nitrous oxide (N2O) • Chlorofluorocarbons (CFCs) • Hydrochlorofluorocarbons (HCFCs) • Perfluorocarbons (PFCs) • Sulphur hexafluoride (SF6) • LLGHGs remain the largest and most important driver of climate change • Evaluation of their trend is one of the fundamental tasks in this chapter.
Radiative Forcing Center of Ocean-Land-Atmosphere studies • Definition • The change in net (down minus up) irradiance (solar plus longwave, [W/m2]) at tropopause (top of atmosphere) after allowing for stratospheric temperatures to readjust to radiative equilibrium, but with surface and tropospheric temperatures and state held fixed at the unperturbed values (Ramaswamy et al. 2001) • ΔTs=λRF • Represents linear view of global mean climate change • Does not attempt to represent the overall climate response • Measure of how the energy balance of the Earth-atmosphere system is influenced when factors that affect climate are altered. Usually quantified as the ‘rate of energy change per unit area of the globe as measured at the top of the atmosphere’ [W/m2] • RF is evaluated as positive, the energy of the Earth-atmosphere system will ultimately increase. Leading to a warming of the system.
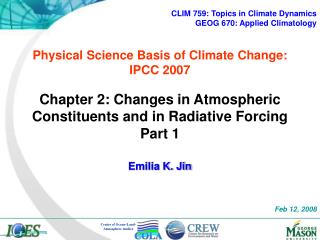
Figure 2.1 Natural RF
Climate Change Drivers Center of Ocean-Land-Atmosphere studies • Forcing agents • LLGHGs • Aerosols and Aerosol precursors • Ozone precursors and ozone-depleting substances • they can be used in state-of-the-art climate models to interactively evolve forcing agent fields along with their associated climate change. • long-term changes in forcing agents arise due to so-called ‘boundary condition” changes to the Earth’s climate system • Response • Aerosol-related cloud changes • etc…
Radiative forcing, defined as the net flux imbalance at the tropopause, is shown by an arrow. Blue line: The unperturbed temperature profile Red line: the perturbed temperature profile Schematic comparing RF calculation methodologies
Climate Change Drivers Center of Ocean-Land-Atmosphere studies In this book, climate change agents that require changes in the tropospheric state (temp. and/or water vapor amounts) prior to causing a radiative perturbation are not considered to be RFs. : aerosol-cloud lifetime effects, semi-direct effects, and some surface change effects Their radiative effects are very climate-model dependent and such a dependence is what the RF concept was designed to avoid. They are too uncertain to be adequately quantified
Limitation of usage of RF Center of Ocean-Land-Atmosphere studies To evaluate the overall climate response associated with a forcing agent, its temporal evolution and its spatial and vertical structure need to be taken into account. RF alone cannot be used to assess the potential climate change associated with emissions, as it does not take into account the different atmospheric lifetimes of the forcing agents. Global Warming Potentials (GWPs) : to compare the integrated RF over a specified period (e.g., 100 years) from a unit mass pulse emission relative to CO2
Center of Ocean-Land-Atmosphere studies How do Human Activity Contribute to Climate Change and How do They Compare with Natural Influence? Human Activity Greenhouse gases Aerosols Altering incoming solar radiation and outgoing infrared (thermal) radiation Burning fossil fuels, etc. Warming since the start of industrial era (about 1975) The human impact on climate during this era greatly exceeds that due to known changes in natural processes, such as solar changes and volcanic eruptions.
Center of Ocean-Land-Atmosphere studies How do Human Activity Contribute to Climate Change and How do They Compare with Natural Influence? Human activities results in emissions of four principal greenhouse gases
Center of Ocean-Land-Atmosphere studies How do Human Activity Contribute to Climate Change and How do They Compare with Natural Influence?
Center of Ocean-Land-Atmosphere studies How do Human Activity Contribute to Climate Change and How do They Compare with Natural Influence? • Radiative forcing of factors affected by human activities • Total forcing relative to the start of the industrial era (Figure 2): • The forcings of greenhouse gas increase are positive because each gas absorbs outgoing infrared radiation in the atmosphere. • Among greenhouse gases, CO2 increases have caused the largest forcing over this period. • Tropospheric ozone increases have also contributed to warming, while stratospheric ozone decreases have contributed to cooling. • Direct forcing of aerosol particles such as reflection and absorption of solar and infrared radiation in the atmosphere: over all negative • Indirect forcing of aerosols through the changes in cloud properties is negative.
Chemically and Radiatively Important Gases Center of Ocean-Land-Atmosphere studies • Atmospheric Carbon Dioxide (CO2) • : mixing ratio of CO2 has increased globally about 100 ppm over the last 250 years (from 275/285 ppm in the pre-industrial era (AD 1000-1750) to 379 ppm in 2005) • From 1750 to 1970s, 50 ppm increase • From 1975 to 2005, 50 ppm increase • From 1995 to 2005, 19 ppm increase • Since the direct instrumental measurements began in the 1950s, the average rate of increase of CO2 is 1.4 ppm / yr over the period 1960 to 2005.
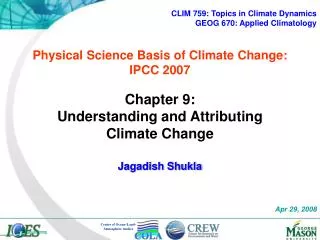
The longest continuous records (In Situ continuous measurement): CO2 concentrations (monthly averages) measured by continuous analysers over the period 1970 to 2005 from Mauna Loa, Hawaii (19°N, black; Keeling and Whorf, 2005) and Baring Head, New Zealand (41°S, blue; following techniques by Manning et al., 1997). Due to the larger amount of terrestrial biosphere in the NH, seasonal cycles in CO2 are larger there than in the SH. In the lower right of the panel, atmospheric oxygen (O2) measurements from flask samples are shown from Alert, Canada (82°N, pink) and Cape Grim, Australia (41°S, cyan) (Manning and Keeling, 2006).
Chemically and Radiatively Important Gases Center of Ocean-Land-Atmosphere studies Increases in global atmospheric CO2 since the industrial revolution are 1) mainly due to CO2 emissions from the combustion of fossil fuels, gas flaring and cement productions 2) Other sources include emission s due to land use changes such as deforestation and biomass burning After entering the atmosphere, CO2 exchanges rapidly with the short-lived components of the terrestrial biosphere and surface ocean. redistributed on time scales of hundreds of years among all active carbon reservoirs including the long-lived terrestrial biosphere and deep ocean.
Chemically and Radiatively Important Gases Center of Ocean-Land-Atmosphere studies • Measurement of CO2 changes • Measurements of the carbon isotopes in CO2 • The carbon contained in CO2 has two naturally occurring stable isotopes denoted 12C and 13C. The first of these, 12C, is the most abundant isotope at about 99%, followed by 13C at about 1%. Emissions of CO2 from coal, gas and oil combustion and land clearing have 13C/12C isotopic ratios that are less than those in atmospheric CO2, and each carries a signature related to its source. Thus, as shown in Prentice et al. (2001), when CO2 from fossil fuel combustion enters the atmosphere, the 13C/12C isotopic ratio in atmospheric CO2 decreases at a predictable rate consistent with emissions • of CO2 from fossil origin. • 2) High-precision measurements of atmospheric oxygen (O2) content • Atmospheric O2 and CO2 changes are inversely coupled during plant respiration and photosynthesis. • Measurements of both the 13C/12C ratio in atmospheric CO2 and atmospheric O2 levels are valuable tools used to determine the distribution of fossil-fuel derived CO2
Annual global CO2 emissions from fossil fuel burning and cement manufacture in GtC yr–1 (black) through 2005, using data from the CDIAC website (Marland et al, 2006) to 2003. Annual averages of the 13C/12C ratio measured in atmospheric CO2 at Mauna Loa from 1981 to 2002 (red) are also shown (Keeling et al, 2005).Note that this scale is inverted to improve clarity.
Chemically and Radiatively Important Gases Center of Ocean-Land-Atmosphere studies Causes of CO2 Increase The emission rate due to fossil fuel burning and cement productionCarbon dioxide emissions due to global annual fossil fuel combustion and cement manufacture combined have increased by 70% over the last 30 years (Marland et al., 2006). The relationship between increases in atmospheric CO2 mixing ratios and emissions has been tracked using a scaling factor known as the apparent ‘airborne fraction’, defined as the ratio of the annual increase in atmospheric CO2 to the CO2 emissions from annual fossil fuel and cement manufacture combined (Keeling et al., 1995). On decadal scales, this fraction has averaged about 60% since the 1950s. The underlying long-term global atmospheric CO2 growth rate will be about 1.9 ppm yr–1, a value consistent with observations over the 1995 to 2005 decade. Carbon dioxide emissions due to land use changes contributing 6% to 39% of the CO2 growth rate during the 1990s (Brovkin et al., 2004). In 2005, the global mean average CO2 mixing ratio is almost 379 ppm.
Chemically and Radiatively Important Gases Center of Ocean-Land-Atmosphere studies Radiative forcing of CO2 The RF calculations usually take 1750 as the pre-industrial index (e.g., the TAR and this report). Using 1860 as an alternative start date for the RF calculations would reduce the LLGHG RF by roughly 10%. The simple formulae for RF of the LLGHG quoted in Ramaswamy et al. (2001) are still valid. These formulae are based on global RF calculations where clouds, stratospheric adjustment and solar absorption are included, and give an RF of +3.7 W m–2 for a doubling in the CO2 mixing ratio. Collins et al. (2006) performed a comparison of five detailed line-by-line models and 20 GCM radiation schemes. The spread of line-by-line model results were consistent with the ±10% uncertainty estimate for the LLGHG RFs adopted in Ramaswamy et al. (2001) and a similar ±10% for the 90% confidence interval is adopted here.
Chemically and Radiatively Important Gases Center of Ocean-Land-Atmosphere studies Radiative forcing of CO2 (Table 2.1) Using the global average value of 379 ppm for atmospheric CO2 in 2005 gives an RF of 1.66 ± 0.17 W m–2 This change is solely due to increases in atmospheric CO2 and is also much larger than the RF changes due to other agents. In the decade 1995 to 2005, the RF due to CO2 increased by about 0.28 W m–2 (20%), an increase greater than that calculated for any decade since at least 1800. The uncertainty in RF is almost entirely due to radiative transfer assumptions and not mixing ratio estimates, therefore trends in RF can be more accurately determined than the absolute RF.
Chemically and Radiatively Important Gases Center of Ocean-Land-Atmosphere studies Atmospheric Methane (CH4 ) Methane has the second-largest RF of the LLGHGs after CO2 (Ramaswamy et al., 2001). Present atmospheric levels of CH4 are unprecedented in at least the last 650 kyr (Spahni et al., 2005). Although the abundance of CH4 has increased by about 30% during the last 25 years, its growth rate has decreased substantially from highs of greater than 1% yr–1 in the late 1970s and early 1980s (Blake and Rowland, 1988) to lows of close to zero towards the end of the 1990s (Dlugokencky et al., 1998; Simpson et al., 2002). The reasons for the decrease of growth rate and the implications for future changes in its atmospheric burden are not understood. But they are clearly related to changes in the imbalance between CH4 sources and sinks. Most CH4 is removed from the atmosphere by reaction with the hydroxyl free radical (OH), which is produced photochemically in the atmosphere.
Figure 2.4 (a) Time series of global CH4 abundance mole fraction (in ppb) derived from surface sites operated by NOAA/GMD (blue lines) and AGAGE (red lines). The thinner lines show the CH4 global averages and the thicker lines are the de-seasonalized global average trends from both networks. (b) Annual growth rate (ppb yr–1) in global atmospheric CH4 abundance from 1984 through the end of 2005 (NOAA/GMD, blue), and from 1988 to the end of 2005 (AGAGE, red).
Chemically and Radiatively Important Gases Center of Ocean-Land-Atmosphere studies • Atmospheric Methane (CH4 ): recent growth rate has decreased • The total global CH4 source is relatively well known but the strength of each source component and their trends are not. • The sources are mostly biogenic and include wetlands, rice agriculture, biomass burning and ruminant animals. Methane is also emitted by various industrial sources including fossil fuel mining and distribution. • Methane is also emitted by various industrial sources including fossil fuel mining and distribution. • ‘bottom-up’ studies can grossly underestimate emissions and ‘top-down’ • measurement-based assessments of reported emissions will be required for verification. • Several wide-ranging hypotheses have been put forward to explain the reduction in the CH4 growth rate and its variability. • The negligible long-term change in its main sink (OH; see Section 2.3.5 and Figure 2.8) implies that CH4 emissions are not increasing. • a stabilisation of CH4 emissions, given that the observations are consistent with stable emissions and lifetime since 1982.
Chemically and Radiatively Important Gases Center of Ocean-Land-Atmosphere studies Atmospheric Methane (CH4 ): relative large growth rate anomalies 1991 case 1) The anomaly in 1991 was followed by a dramatic drop in the growth rate in 1992 and has been linked with the Mt. Pinatubo volcanic eruption in June 1991, which injected large amounts of ash and (sulphur dioxide) SO2 into the lower stratosphere of the tropics with subsequent impacts on tropical photochemistry and the removal of CH4 by atmospheric OH (Bekki et al., 1994; Dlugokencky et al., 1996). 2) Lelieveld et al. (1998) and Walter et al. (2001a,b) proposed that lower temperatures and lower precipitation in the aftermath of the Mt. Pinatubo eruption could have suppressed CH4 emissions from wetlands. 1998 case 1) Dlugokencky et al. (2001) suggested that wetland and boreal biomass burning sources might have contributed to the anomaly, noting that 1998 was the warmest year globally since surface instrumental temperature records began. 2) The same conclusion was reached by Morimoto et al. (2006), who used carbon isotopic measurements of CH4 to constrain the relative contributions of biomass burning (one-third) and wetlands (two-thirds) to the increase.
Chemically and Radiatively Important Gases Center of Ocean-Land-Atmosphere studies Atmospheric Methane (CH4 ): relative large growth rate anomalies 1991 case 1) The anomaly in 1991 was followed by a dramatic drop in the growth rate in 1992 and has been linked with the Mt. Pinatubo volcanic eruption in June 1991, which injected large amounts of ash and (sulphur dioxide) SO2 into the lower stratosphere of the tropics with subsequent impacts on tropical photochemistry and the removal of CH4 by atmospheric OH (Bekki et al., 1994; Dlugokencky et al., 1996). 2) Lelieveld et al. (1998) and Walter et al. (2001a,b) proposed that lower temperatures and lower precipitation in the aftermath of the Mt. Pinatubo eruption could have suppressed CH4 emissions from wetlands. 1998 case 1) Dlugokencky et al. (2001) suggested that wetland and boreal biomass burning sources might have contributed to the anomaly, noting that 1998 was the warmest year globally since surface instrumental temperature records began. 2) The same conclusion was reached by Morimoto et al. (2006), who used carbon isotopic measurements of CH4 to constrain the relative contributions of biomass burning (one-third) and wetlands (two-thirds) to the increase.
Chemically and Radiatively Important Gases Center of Ocean-Land-Atmosphere studies RF of Atmospheric Methane (CH4 ) The pre-industrial global value for CH4 from 1700 to 1800 was 715 ± 4 ppb (it was also 715 ± 4 ppb in 1750), thus providing the reference level for the RF calculation. The uncertainty range in mixing ratios for the present day represents intra-annual variability, which is not included in the pre-industrial uncertainty estimate derived solely from ice core sampling precision. The spectral absorption by CH4 is overlapped to some extent by N2O lines (taken into account in the simplified expression). Taking the overlapping lines into account using current N2O mixing ratios instead of pre-industrial mixing ratios (as in Ramaswamy et al., 2001) reduces the current RF due to CH4 by 1%.
Chemically and Radiatively Important Gases Center of Ocean-Land-Atmosphere studies Other Kyoto Protocol Gases: N2O At the time of the TAR, N2O had the fourth largest RF among the LLGHGs behind CO2, CH4 and CFC-12. As CFC-12 levels slowly decline (see Section 2.3.4), N2O should, with its current trend, take over third place in the LLGHG RF ranking. This RF is affected by atmospheric CH4 levels due to overlapping absorptions As N2O is also the major source of ozone-depleting nitric oxide (NO) and nitrogen dioxide (NO2) in the stratosphere, it is routinely reviewed in the ozone assessments; the most recent assessment (Montzka et al., 2003) recommended an atmospheric lifetime of 114 years for N2O. The primary driver for the industrial era increase of N2O was concluded to be enhanced microbial production in expanding and fertilized agricultural lands. Since 1998, atmospheric N2O levels have steadily risen to 319 ± 0.12 ppb in 2005, and levels have been increasing approximately linearly (at around 0.26% yr–1) for the past few decades (Figure 2.5).
The general decrease in the variability of the measurements over time is due mainly to improved instrumental precision. The real signal emerges only in the last decade.
Chemically and Radiatively Important Gases Center of Ocean-Land-Atmosphere studies Other Kyoto Protocol Gases: Human made PFCs, HFCs, SF6 Absorption spectra of most halocarbons reviewed here and in the following section are characterised by strongly overlapping spectral lines that are not resolved at tropospheric pressures and temperatures, and there is some uncertainty in cross section measurements. Differences in the radiative flux calculations can arise from the spectral resolution used, tropopause heights, vertical, spatial and seasonal distributions of the gases, cloud cover and how stratospheric temperature adjustments are performed.
Chemically and Radiatively Important Gases Center of Ocean-Land-Atmosphere studies Other Kyoto Protocol Gases: Human made PFCs, HFCs, SF6 The observed mixing ratios of the HFCs in the atmosphere can be explained by the anthropogenic emissions. It show a continuation of positive HFC trends and increasing latitudinal gradients (larger trends in the NH) due to their predominantly NH sources. The air conditioning refrigerant HFC-134a is increasing at a rapid rate in response to growing emissions arising from its role as a replacement for some CFC refrigerants. HFC-152a, with a lifetime of only about 1.5 years, is rising approximately exponentially, with the effects of increasing emissions only partly offset by its rapid atmospheric destruction.
Chemically and Radiatively Important Gases Center of Ocean-Land-Atmosphere studies Other Kyoto Protocol Gases: Human made PFCs, HFCs, SF6 The PFCs, mainly CF4 (PFC-14) and C2F6 (PFC-116), and SF6 have very large radiative effi ciencies and lifetimes in the range 1,000 to 50,000 years (see Section 2.10, Table 2.14), and make an essentially permanent contribution to RF. These PFCs are produced as byproducts of traditional aluminium production, among other activities. The CF4 concentrations have been increasing linearly since about 1960 and CF4 has a natural source that accounts for about one-half of its current atmospheric content (Harnisch et al., 1996). Sulphur hexafl uoride (SF6) is produced for use as an electrical insulating fluid in power distribution equipment and also deliberately released as an essentially inert tracer to study atmospheric and oceanic transport processes.
Chemically and Radiatively Important Gases Center of Ocean-Land-Atmosphere studies Montreal Protocol Gases: CFCs, HCFCs, chlorocarbons, bromocarbons and halons The Montreal Protocol on Substances that Deplete the Ozone Layer regulates many radiatively powerful greenhouse gases for the primary purpose of lowering stratospheric chlorine and bromine concentrations. The Montreal Protocol gases have contributed 12% (0.320 W m–2) to the direct RF of all LLGHGs. This contribution is dominated by the CFCs. The combined CO2-equivalent emissions of CFCs, HCFCs and HFCs decreased from a peak of about 7.5 GtCO2-eq yr–1 in the late 1980s to about 2.5 GtCO2-eq yr–1 by the year 2000, corresponding to about 10% of that year’s CO2 emissions due to global fossil fuel burning. Two of the major CFCs (CFC-11 and CFC-113) have both been decreasing in the atmosphere since the mid-1990s. While their emissions have decreased very substantially in response to the Montreal Protocol, their long lifetimes of around 45 and 85 years, respectively, mean that their sinks can reduce their levels by only about 2% and 1% yr–1, respectively.
Chemically and Radiatively Important Gases Center of Ocean-Land-Atmosphere studies Montreal Protocol Gases: CFCs, HCFCs, chlorocarbons, bromocarbons and halons The combined CO2-equivalent emissions of CFCs, HCFCs and HFCs decreased from a peak of about 7.5 GtCO2-eq yr–1 in the late 1980s to about 2.5 GtCO2-eq yr–1 by the year 2000, corresponding to about 10% of that year’s CO2 emissions due to global fossil fuel burning. Two of the major CFCs (CFC-11 and CFC-113) have both been decreasing in the atmosphere since the mid-1990s. While their emissions have decreased very substantially in response to the Montreal Protocol, their long lifetimes of around 45 and 85 years, respectively, mean that their sinks can reduce their levels by only about 2% and 1% yr–1, respectively. Other major CFC (CFC-12), which is the third most important LLGHG, is finally reaching a plateau in its atmospheric levels (emissions equal loss) and may have peaked in 2003. The combined CFC and HCFC RF has been slowly declining since 2003.
Chemically and Radiatively Important Gases Center of Ocean-Land-Atmosphere studies Montreal Protocol Gases: CFCs, HCFCs, chlorocarbons, bromocarbons and halons The major solvent, methyl chloroform (CH3CCl3), is of special importance regarding RFs, because this gas is widely used to estimate concentrations of OH, which is the major sink species for CH4, HFCs, and HCFCs and a major production mechanism for sulphate, nitrate and some organic aerosols. The global atmospheric methyl chloroform concentration rose steadily from 1978 to reach a maximum in 1992 (Prinn et al., 2001; Montzka et al., 2003). Since then, concentrations have decreased rapidly, driven by a relatively short lifetime of 4.9 years and phase-out under the Montreal Protocol,
Chemically and Radiatively Important Gases Center of Ocean-Land-Atmosphere studies Montreal Protocol Gases: CFCs, HCFCs, chlorocarbons, bromocarbons and halons Levels peaked in early 1990 and decreased approximately linearly since then (Figure 2.7). Its major use was as a feedstock for CFC manufacturing. Unlike methyl chloroform, a signifi cant inter-hemispheric CCl4 gradient still exists in 2005 in spite of its moderately long lifetime of 20 to 30 years, resulting from a persistence of signifi cant NH emissions.
Chemically and Radiatively Important Gases Center of Ocean-Land-Atmosphere studies Montreal Protocol Gases: CFCs, HCFCs, chlorocarbons, bromocarbons and halons HCFCs of industrial importance have lifetimes in the range of 1.3 to 20 years. Global emissions of HCFC-22 rose steadily over the period 1975 to 2000, while those of HCFC-141b and HCFC-142b started increasing quickly in the early 1990s and then began to decrease after 2000.
Chemically and Radiatively Important Gases Center of Ocean-Land-Atmosphere studies Trends in the Hydroxyl Free Radical (OH) The hydroxyl free radical (OH) is the major oxidizing chemical in the atmosphere, destroying about 3.7 Gt of trace gases, including CH4 and all HFCs and HCFCs, each year (Ehhalt, 1999). The best trace gas used to date for this purpose is methyl chloroform. Indirect measurements of OH using methyl chloroform have established
Chemically and Radiatively Important Gases Center of Ocean-Land-Atmosphere studies Trends in the Hydroxyl Free Radical (OH) The OH maximum around 1989 and a larger OH minimum around 1998, with OH concentrations then recovering so that in 2003 they were comparable to those in 1979. The 1997 to 1999 OH minimum coincides with, and is likely caused by, major global wildfires and an intense El Niño at that time. Methyl chloroform is also destroyed in the stratosphere. Because its stratospheric loss frequency is less than that in the troposphere, the stratosphere becomes a less effective sink for tropospheric methyl chloroform over time (Krol and Lelieveld, 2003) Wennberg et al. (2004) recently proposed that the polar oceans may have effectively stored methyl chloroform during the pre-1992 years when its atmospheric levels were rising, but began re-emitting it in subsequent years, thus reducing the overall oceanic sink.
Chemically and Radiatively Important Gases Center of Ocean-Land-Atmosphere studies Stratospheric Ozone Global ozone amounts decreased between the late 1970s and early 1990s, with the lowest values occurring during 1992 to 1993 (roughly 6% below the 1964 to 1980 average), and slightly increasing values thereafter. Whether or not recently observed changes in ozone trends (Newchurch et al., 2003; Weatherhead and Andersen, 2006) are already indicative of recovery of the global ozone layer is not yet clear and requires more detailed attribution of the drivers of the changes (Steinbrecht et al., 2004a Ozone decreases over the Arctic have been less severe than have those over the Antarctic, due to higher temperature in the lower stratosphere and thus fewer polar stratospheric clouds to cause the chemical destruction. Arctic stratospheric ozone levels are more variable due to interannual variability in chemical loss and transport.
Chemically and Radiatively Important Gases Center of Ocean-Land-Atmosphere studies • Stratospheric Ozone • RF for 1979 to 1998 to about –0.05 ±0.05 W m–2 based on observational studies. • Gauss et al. (2006) compared results from six chemical transport models that included changes in ozone precursors to simulate both the increase in the ozone in the troposphere and the ozone reduction in the stratosphere over the industrial era. • All models have a maximum ozone reduction around 15 km at high latitudes in the SH. • The resulting stratospheric ozone RF ranged between –0.12 and +0.07 W m–2. Note that the models with either a small negative or a positive RF also had a small increase in tropical lower stratospheric ozone, resulting from increases in tropospheric ozone precursors; most of this increase would have occurred before the time of stratospheric ozone destruction by the Montreal Protocol gases. • The stratospheric ozone RF is assessed to be –0.05 ± 0.10 W m–2 between pre-industrial times and 2005.
Chemically and Radiatively Important Gases Center of Ocean-Land-Atmosphere studies Tropical Ozone The TAR estimate of RF from tropospheric ozone was +0.35 ± 0.15 W m–2. In the TAR, the models considered only changes in the tropospheric photochemical system, driven by estimated emission changes (NOx, CO, nonmethane volatile organic compounds (NMVOCs), and CH4) since pre-industrial times. Since the TAR, there have been major improvements in models. The new generation models include several Chemical Transport Models (CTMs) that couple stratospheric and tropospheric chemistry, as well as GCMs with on-line chemistry (both tropospheric and stratospheric). While the TAR simulations did not consider changes in ozone within the troposphere caused by reduced influx of ozone from the stratosphere (due to ozone depletion in the stratosphere), the new models include this process (Gauss et al., 2006).
Chemically and Radiatively Important Gases Center of Ocean-Land-Atmosphere studies Tropical Ozone The TAR estimate of RF from tropospheric ozone was +0.35 ± 0.15 W m–2. In the TAR, the models considered only changes in the tropospheric photochemical system, driven by estimated emission changes (NOx, CO, nonmethane volatile organic compounds (NMVOCs), and CH4) since pre-industrial times. Since the TAR, there have been major improvements in models. The new generation models include several Chemical Transport Models (CTMs) that couple stratospheric and tropospheric chemistry, as well as GCMs with on-line chemistry (both tropospheric and stratospheric). While the TAR simulations did not consider changes in ozone within the troposphere caused by reduced influx of ozone from the stratosphere (due to ozone depletion in the stratosphere), the new models include this process (Gauss et al., 2006). The normalised adjusted RF for the ACCENT models was +0.032 ± 0.006 W m–2 DU–1, which is significantly lower than the TAR estimate of +0.042 W m–2 DU–1.